react-svg-graphs v2.1.12
react-svg-graphs
React SVG graphs is a library I wrote to render high-quality SVG graphs of scalar data. It is useful for things like metrics, but not statistics. Focus here is on specific use cases (e.g. temporal data), not to support a wide range of graphing requirements.
Status
This is being used in production since 1.6.x so you can consider it stable.
Installation
$ npm i react-svg-graphsRequirements
You need to import Roboto Mono into your stylesheets somewhere, e.g.
<link href="https://fonts.googleapis.com/css?family=Roboto+Mono&display=swap" rel="stylesheet">Features
4 types of graph are supported: 1. Scalar data on a scalar X-axis. 1. Scalar data over time. 1. Aggregated scalar data over time (e.g. a graph showing HTTP 200 responses over time, a la Heroku metrics). 1. Sparklines.
Limitations
- If you want to display more than 10 sets of data you have to supply your own color palette.
- No custom styling or configurations.
Testing
Running
$ npm run test:functionalwill start a dev server and show the SVG outputs of different tests.
Usage:
The code in functional tests (see above) will show how to structure your data to generate graphs. The top-level components are:
<ScalarXScalarYGraph />
<TimeXScalarYGraph />
<TimeXAggregateYGraph />
<Sparkline />
For example:
import React from 'react'
import { render } from 'react-dom'

import { ScalarXScalarYGraph } from 'react-svg-graphs'

const data1 = [
  {
    label: 'A',
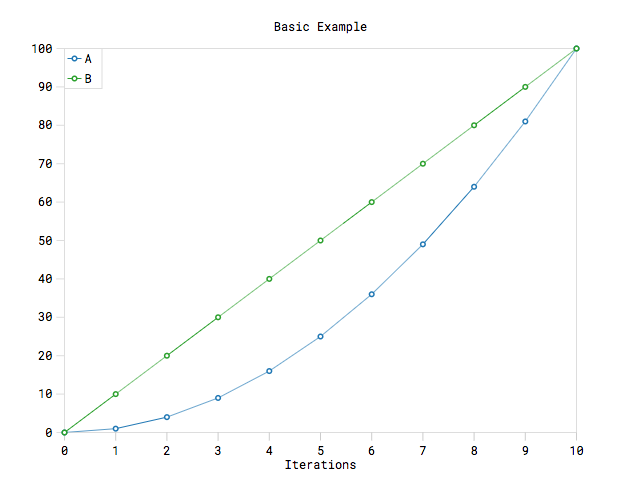
    values: [0, 1, 2, 3, 4, 5, 6, 7, 8, 9, 10].map(a => ({ x: a, y: a * a }))
  },
  {
    label: 'B',
    values: [0, 1, 2, 3, 4, 5, 6, 7, 8, 9, 10].map(b => ({ x: b, y: b * 10 }))
  }
]

render(
  <ScalarXScalarYGraph
    data={data1}
    width={width}
    height={height}
    title='Basic Example'
    xLabel='Iterations'
    onHover={hoverInfo => console.log('hover info:', hoverInfo)}
  />,
  document.getElementById('contents')
)
Result:

5 years ago
5 years ago
5 years ago
5 years ago
5 years ago
5 years ago
6 years ago
6 years ago
6 years ago
6 years ago
6 years ago
6 years ago
6 years ago
6 years ago
6 years ago
6 years ago
6 years ago
6 years ago
6 years ago
6 years ago
6 years ago
6 years ago
7 years ago
7 years ago
7 years ago
7 years ago
7 years ago
7 years ago
7 years ago
7 years ago
7 years ago
7 years ago
7 years ago
7 years ago
7 years ago
7 years ago
7 years ago
7 years ago
7 years ago
7 years ago
7 years ago
7 years ago
7 years ago
7 years ago
7 years ago
8 years ago
8 years ago
8 years ago
8 years ago
8 years ago
8 years ago
8 years ago
