1.1.2 • Published 2 years ago
rn-animated-donut-chart v1.1.2
RN-Animated-Donut-Chart is a dynamic donut chart with an infinit numbers of categories and can be used as a half and full donut chart.
It comes with a built-in TypeScript typings and is compatible with all popular JavaScript frameworks including React , Vue , Svelte , and Angular . You can use RN-Animated-Donut-Chart directly or leverage well-maintained wrapper packages that allow for a more native integration with your frameworks of choice.
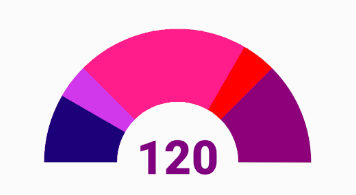
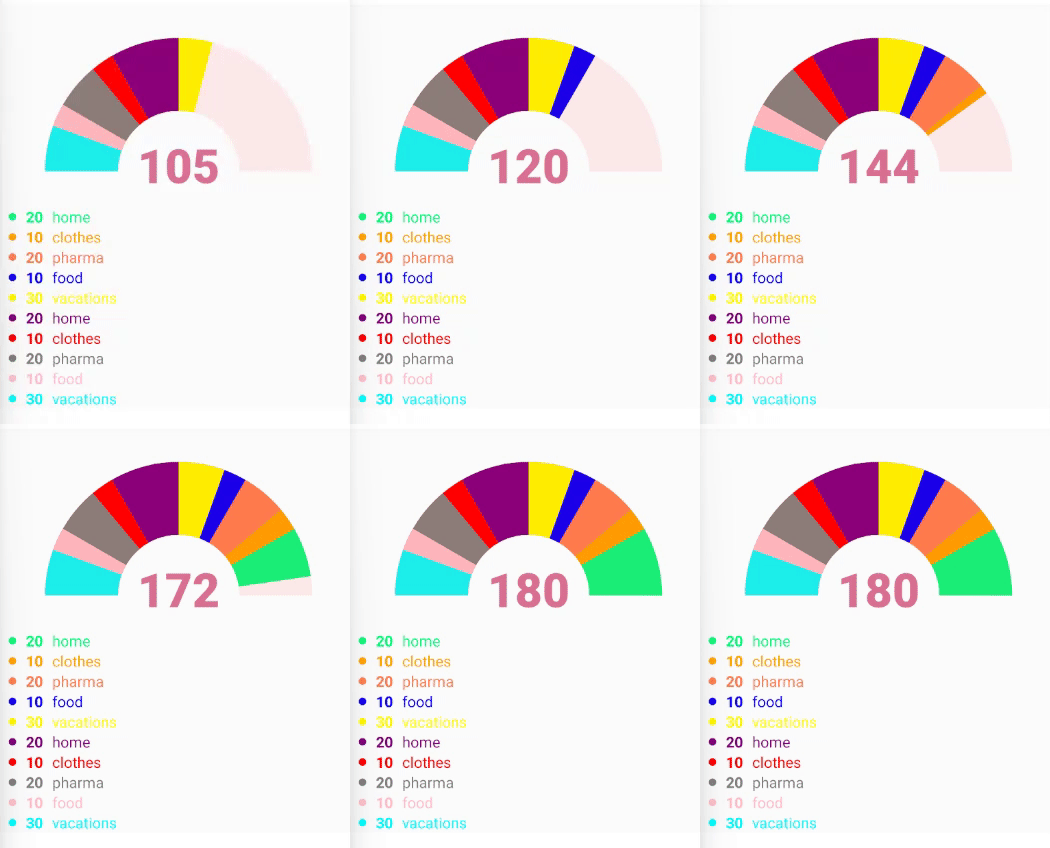
Semi circular donut chart:


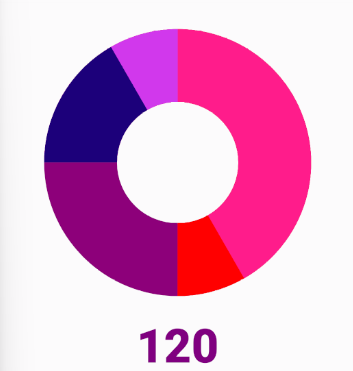
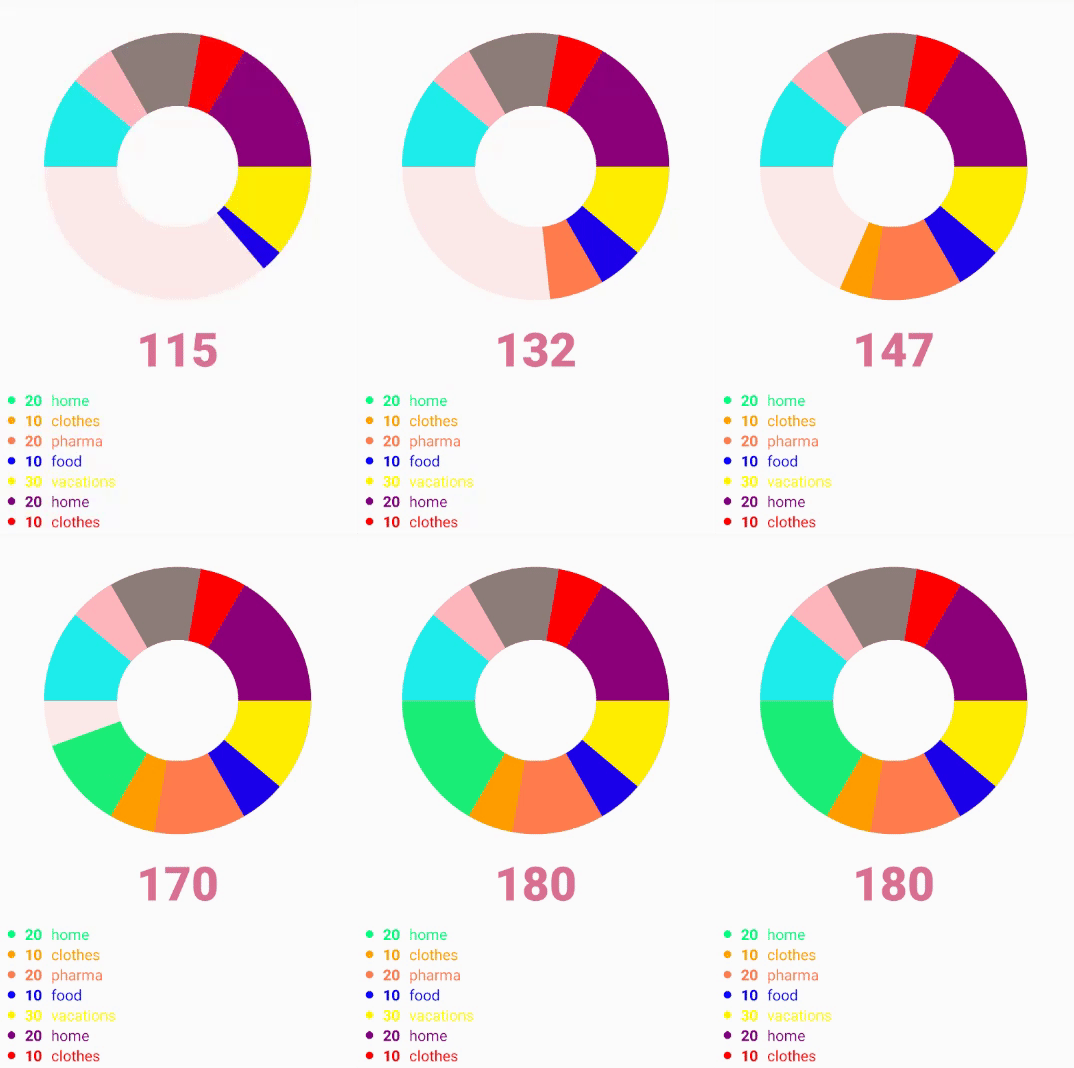
Full circular donut chart:


Dataset Properties
| Name | Type | Default |
|---|---|---|
| precentegs | Precentage[] | [] |
| radius | number | 200 |
| strokeWidth | number | 150 |
| duration | number | 500 |
| backColor | string | "tomato" |
| textColor | string | "black" |
| strokeLinecap | string | "none" |
| rotation | number | 180 |
| isCemiCircle | boolean | true |
| isShowDescription | boolean | false |
| isShowTotalValue | boolean | true |
| totalValueStyle | TextStyle | null |
| textDescriptionStyle | TextStyle | null |
| valueDescriptionStyle | TextStyle | null |
| dotDescriptionStyle | TextStyle | null |
| easing | any | Easing.out(Easing.ease) |