0.1.4 • Published 2 years ago
rn-chart-desk v0.1.4
rn-chart-desk 📊
A powerful & easy to use chart library for creating customizable charts in React Native (Please note that this package does not have iOS support yet).
Table of content:
TODO: iOS Version
⚠️ When passing data to any of the charts, make sure you pass as JSON.stringify()
Installation
npm install rn-chart-deskLineChart

import { LineChart } from "rn-chart-desk";

// ...

<LineChart
	style={{ flex: 1 }}
	data={JSON.stringify({
		values: [34, 2, 15, 29, 5],
		label: "Second Test",
		color: 'blue'
	})}
	description={""}
	xAxisLabels={JSON.stringify(["Subday", "Monday", "Tuesday", "Wednesday", "Thursday"])}
  roundValues={true}
/>
PieChart

import { PieChart } from "rn-chart-desk";

// ...

<PieChart
	style={{ flex: 1 }}
	data={JSON.stringify([
		{
			value: 5,
			label: "Label 1"
		},
		{
			value: 7,
			label: "Label 2"
		},
		{
			value: 20,
			label: "Label 3"
		},
	])}
	description={"Pie chart for data"}
	roundValues={true}
/>
BarChart

import { BarChart } from "rn-chart-desk";

// ...

<BarChart
	style={{ flex: 1 }}
	data={JSON.stringify({
			values: [34, 2, 15, 29, 5],
			label: "Second Test",
			color: "blue"
		},
	)}
	description={"Bar chart for data"}
	xAxisLabels={JSON.stringify(["Jan", "Feb", "Mar", "Apr", "May"])}
	roundValues={false}
/>
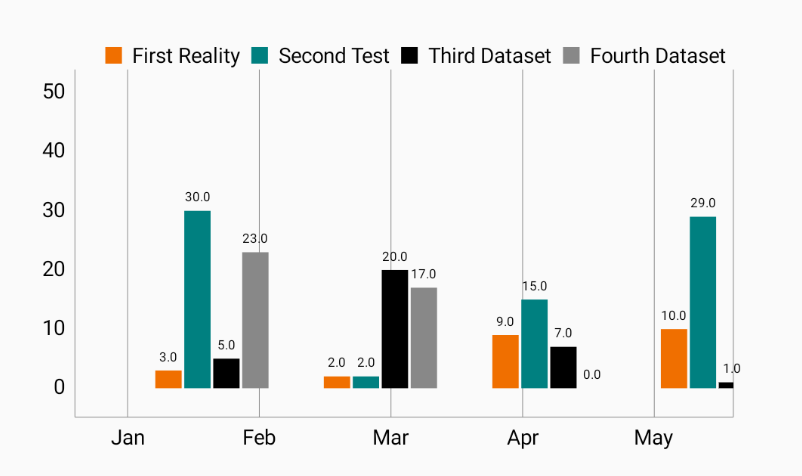
GroupedBarChart

import { GroupedBarChart } from "rn-chart-desk";

// ...

<GroupedBarChart
  style={{ flex: 1 }}
  data={JSON.stringify([
    {
      values: [3, 2, 9, 10, 3],
      label: "First Dataset",
      color: "#F06F00"
    },
    {
      values: [5, 20, 7, 1, 34],
      label: "Second Dataset",
      color: 'blue'
    },
    {
      values: [30, 2, 15, 29, 5],
      label: "Third Dataset",
      color: 'green'
    },
  ])}
  description={""}
  xAxisLabels={JSON.stringify(["Jan", "Feb", "Mar", "Apr", "May"])}
  roundValues={true}
/>
Remove decimal places on chart values
You can round all values on any of the charts by setting roundValues to true or false
roundValues={true | false}Author
Cheers 🥂
Acknowlegement
This package was made possible, thanks to being able to leverage and build on top of the amazing work that was done on MPAndroidChart.
Contributing
See the contributing guide to learn how to contribute to the repository and the development workflow.
License
MIT