1.0.3 • Published 6 years ago
saber-bar-chart v1.0.3
saber-bar-chart
created by: Chad Sterling
Do you need more bar charts in your life but don't want to go through the pain of setting them up? Are you finding in this post "Rise of Skywalker" era that there aren't enough lightsaber-ings happening in this world? well Have i got the solution for you! a LightSaber-ish barchart!
Features:
- Star Field Background put together by Keith Clark: https://codepen.io/keithclark/pen/zqcEd
- Identify the colors for the various light sabers in your bar chart
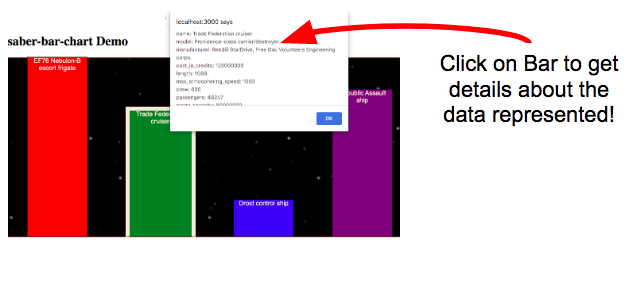
- Create a popup for each of your bars that give the viewer additional data details
- this is in react, so all you gotta do is drop this into the middle of your project and you're good to go in style
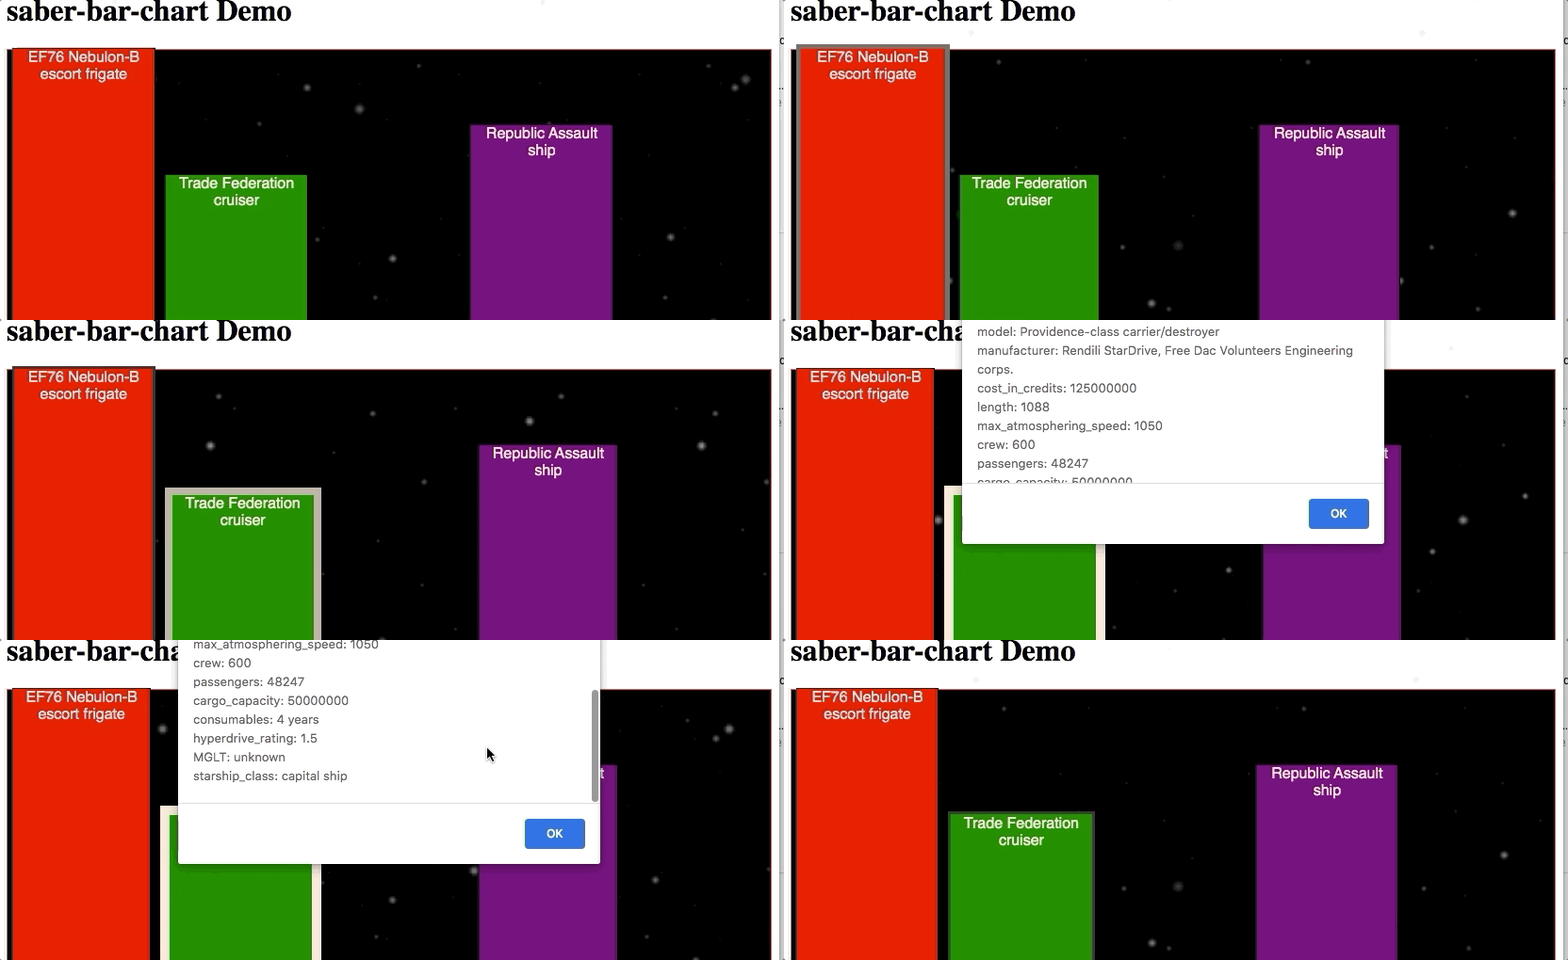
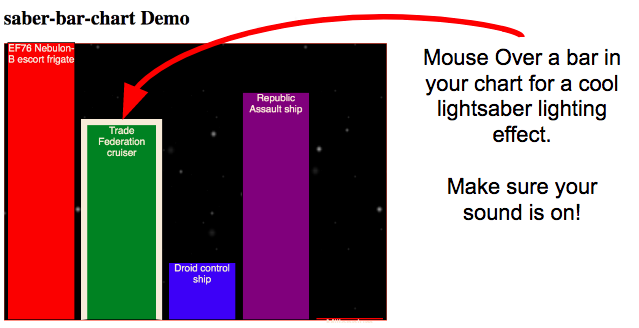
- mousing over any bar in your graph gives a cool lightsaber sound effect!!

Requirements: in order to use the barchart, it requires data to be set up in a specific way
Color Array
- this is an array of colors (represented as strings). these colors will represent the colors of the bars in your graph. Note that if you have more bars than colors in your color array, the colors will just repeat from the begining. You want striping? Just use 2 colors. Here is my example from the demo
- colors = "red", "green", "blue", "purple"
- this array is then passed into the ColorArray property in your SaberBarChart

Bar Data
- this is an list of objects that contain information about the bars in your data
- Each object in your list should contain 3 key value pairs:
- label - this is the string that you want to label your bar with
- value - this is the value your bar represents. Note that bars are displayed relative to each other, so no need to include units, just a number value
- details - this is an object that contains key value pairs for information about the object in question. When the bar is clicked on, this is the data tha is displayed
- Here's an example of what the bar Data should look like:
    barData=[
    {
        label: "EF76 Nebulon-B escort frigate",
        value: 854,
        details: {
            "name": "EF76 Nebulon-B escort frigate",
            "manufacturer": "Kuat Drive Yards",
            "cost_in_credits": "8500000",
            "length": "300",
            "max_atmosphering_speed": "800",
            "crew": "854",
            "passengers": "75",
        },
    },
    {
        label: "Trade Federation cruiser",
        value: 600,
        details: {
            "name": "Trade Federation cruiser",
            "model": "Providence-class carrier/destroyer",
            "manufacturer": "Rendili StarDrive, Free Dac Volunteers Engineering corps.",
        },
    },
    ]
This essentially gives you 2 bars and the details that will pop up when the user clicks on either of the bars

so in order to get your Saber Bar Chart going, just pass your 2 parameters into the bar chart and let me do the rest:
   <SaberBarChart
        ColorArray = {this.colors}
        Bars = {this.barData}
/> - Note: the properties are named ColorArray and Bars
Voila


