signalk-tank-monitor v1.2.1
signalk-tank-monitor
Signal K Node Server plugin implementing tank level logging.
Tank level readings are harvested from the host Signal K Node server and stored in a round-robin database. Periodically, data from the database is used to generate graphs which illustrate the changes in tank levels over time.

System requirements
Sufficient storage to hold the round-robin database and the generated image files. Each monitored tank sensor requires around 4MB of database storage and there is a small system overhead of about 2MB. The plugin generates four SVG image files which in total occupy about 0.5MB.
RRDtool. This application is part of most Linux distibutions.
Installation
If you don't have it already, install rrdtool on your Signal K Node server host. Use your system's package manager, or download and install a suitable version from the RRDtool download page.
Download and install signalk-tank-monitor using the Appstore link in your Signal K server console. The plugin can also be downloaded from the project homepage and installed using these instructions.
Usage
Activating the plugin
In the server main menu navigate to Server->Plugin config and select Tank Monitor to access the plugin configuration screen.
This screen is principally concerned with setting up the display characteristics for each of the tank sensor data streams which will be monitored by the plugin and the list of tank sensors presented on the screen is recovered directly from the host Signal K server.
If the configuration page displays no or fewer tank sensors than expected then you should stop configuring this plugin and check your sensor hardware and connections and your Signal K installation to identify why the server is not identifying your tank sensor streams.
Otherwise, continue by reviewing the screen options (all of which are described below) and making changes which match your requirement. When you are satisfied, check the Active option and click Submit.
The plugin will create a new database and immediately start logging received tank data. In due course, the system will begin generating graphical output.
If you add sensors to your system after you have activated the plugin,
then you will need to recreate the tank monitor database.
The simplest way to do this is to delete the plugin configuration file
in the server's plugin-config-data/ sub-directory: the file in
question is called tank-monitor.json.
Then resart the Signal K Node server from the server main menu and
go on to re-activate signalk_tank_monitor.
Customising plugin operation
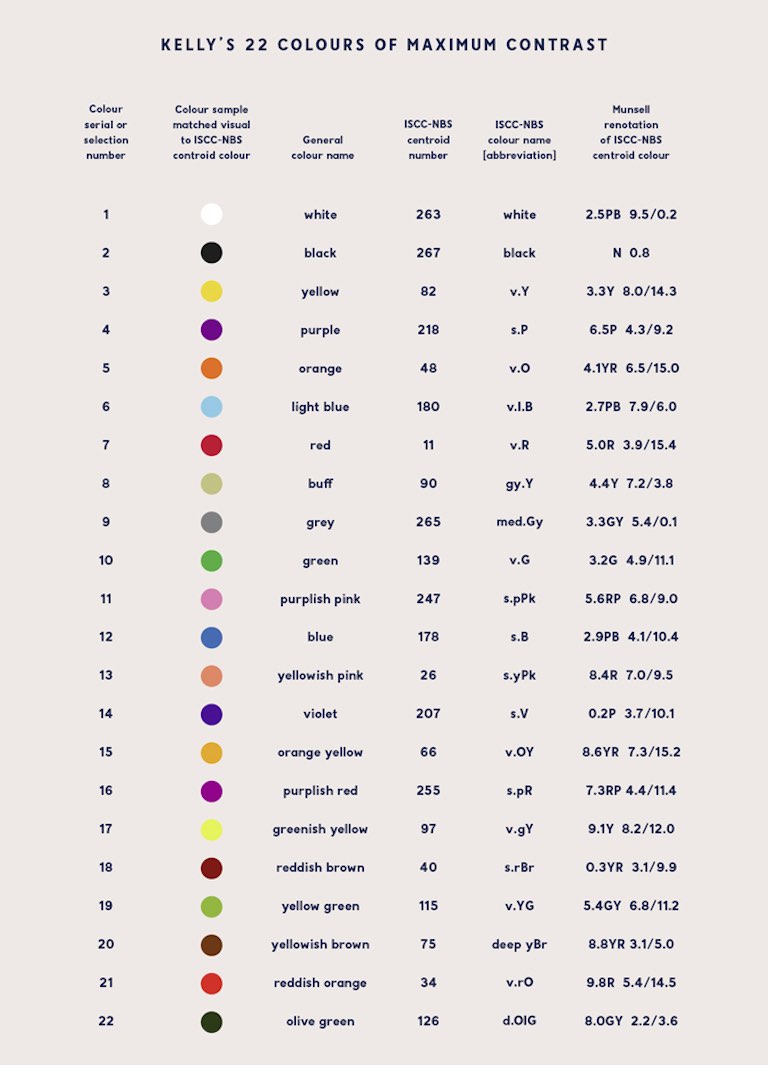
You should tweak the plugin configuration to suit your individual requirements. Most likely you will at least want to give each detected sensor channel a meaningful reporting name. You may also want to change the colours used for each channel in graphical output: the plugin arbitrarily assigns colours from Kelly's pallette of colours of maximum contrast.
The full set of configuration options are described below.
Database name. This option specifies the pathname that will be used
for the plugin's round-robin database.
The default behaviour is to create a file called tanklevels.rrd in the plugin
install directory.
You can change this value to an absolute pathname (i.e. one beginning with the '/' character) or to a relative pathname (offset from the plugin install directory). If you specify a pathname outside the plugin install directory, then make sure that the included directory exists and has appropriate permissions to allow the database to be created and updated by the owner of the executing Signal K Node server.
Output directory. This option specifies the directory where graphical
reports of database content will be stored.
The default behaviour is to store graphical output in the public/ folder
within the plugin install directory.
You can change this location to either an absolute or relative path, but do
make sure that the new location has permissions which will allow files to be
created and updated by the owner of the executing Signal K Node server.
Be aware also that the plugin webapp (see below) can only display graphs
which are located in the default public/ folder.
Setting this option to the empty string will disable graph generation.
Report tank levels to console. Checking this option will cause the plugin to update its status on the server console each time a database update occurs with a terse message indicating current tank levels.
The default behaviour is not to report tank levels.
Sensor list. This is a list of the monitored tank sensor paths. After a new install the list will include all sensor paths available on the host server. You can delete the entry for any sensor you wish to ignore and so terminate monitoring of the associated sensor channel.
Each sensor channel has four option properties:
Path. The name of the sensor path recovered from the Signal K Node server. This value cannot be changed.
Tank capacity. The capacity in cubic metres of the tank being monitored (if this value is available in Signal K (it may be in an N2K context) then this option will be configured automatically). Review this value and amend as necessary, bearing in mind that the data is only used for descriptive purposed in graphical output.
Display name. The name to be used to identify the sensor in graphical output. The default value is derived from the sensor path and may be inscrutable. Values may not include whitespace.
Colour to use for graphical rendering. The colour to be used to render this sensor's data in graphical output. Use the colour selector widget to choose something.
Viewing graphical output
You can review signalk-tank-monitor's graphical output by navigating to the associated webapp using the Signal K Node server console's Webapps menu option.
The plugin maintains four graphs visualising data for the past day, week, month and year. Each graph is refreshed at an appropriate time interval interval (the 'day' graph every five minutes; the 'year' graph every day) and it may therefore take a little while for all four graphs to appear in a new installation.
Notifications, warnings and errors
Notifications
connected to n sensor streams"
The plugin has connected to n tank sensor streams and is starting to log data.
connected to n sensor streams (a,b,...)"
The plugin has connected to n tank sensor streams and has just updated the database with the indicated values.
creating new database 'database-name'
The plugin is creating a new database with the indicated filename.
Warnings
graph generation disabled
The plugin configuration supplies an empty graph directory name and hence no output graphs will be produced.
Errors
cannot find required command 'rrdtool'
The rrdtool command is not available on the host server.
Install RRDtool using your operating system's package manager.
cannot save plugin options
The host Signal K Node server was unable to update the plugin's configuration options on disk: this is a critical system error and is not associated with the configuration or operation of the plugin.
database filename cannot be blank
The plugin configuration must supply a name for the round-robin database to be used by the plugin and it does not. Correct and update the plugin configuration.
database missing
The database has disappeared.
graph directory is not accessible
The plugin configuration supplies a graph directory name which points to a location in which the plugin cannot create file: most likely the specified directory doesn't exist or its access permissions are too restrictive.
unable to create database 'database-filename'
The plugin's attempt to create a new round-robin database has failed: most likely the specified database directory doesn't exist or its access permissions are too restrictive.
unable to detect any tank sensor data streams
The host Signal K Node server is not serving any tank level data: this is a problem with configuration of the host environment - if the server can't see any tank data then the plugin cannot either.
Version history
1.2.1 10 November 2018
Added this version history to documentation.
1.2.0 10 November 2018
Added detection of tank sensor data streams before first configuration.
Added automatic colour selection for data stream graphing.
1.1.0 2 November 2018
Added sanity check to see if RRDtool has actually been installed.
Added scan configuration option to force re-acquisition of tank sensor data streams from server.
1.0.1 29 October 2018
Improvement to documentation.
1.0.0 28 October 2018
First release
License
signalk-tank-monitor is released under Apache License 2.0.
Further reading
Green-Armytage, Paul, "A Colour Alphabet and the Limits of Colour Coding"