1.0.3 • Published 3 years ago
splom v1.0.3
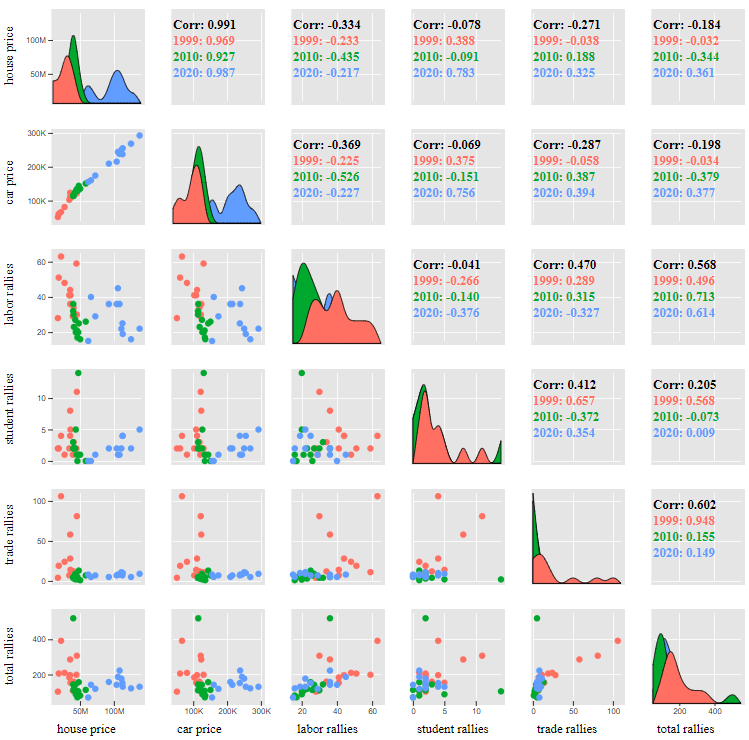
Splom chart with diagonal area chart

how to use
can use chart in html or npm
HTML
Add the following code to the html body
Note:
<script src="data.js"></script>is sample data.
<div id="splom"></div>
<script src="data.js"></script>
<script src="bundle.js"></script>
<script>
    var fileds = ["house_price", "car_price", "labor_rallies", "student_rallies", "trade_rallies", "total_rallies"]
    var labels = ["house price", "car price", "labor rallies", "student rallies", "trade rallies", "total rallies"]
    var categoryColor = ["#ff7062", "#00a82d", "#609dfe"]

    new splom.buildSplom('splom', {
      data: dataAll,
      options: {
        fileds: fileds,
        labels: labels,
        categoryColor: categoryColor,
        categoryField: 'year'
      }
    })
</script>- fileds: key json data for use in chart
- labels: The display name of the field in the chart
- categoryField: categorys of the field
- categoryColor: The display color of the field category in the chart
NPM
npm i splomimport { buildSplom } from 'splom';
var fileds = ["house_price", "car_price", "labor_rallies", "student_rallies", "trade_rallies", "total_rallies"]
var labels = ["house price", "car price", "labor rallies", "student rallies", "trade rallies", "total rallies"]
var categoryColor = ["#ff7062", "#00a82d", "#609dfe"]
new buildSplom('splom', {
data: dataAll,
options: {
fileds: fileds,
labels: labels,
categoryColor: categoryColor,
categoryField: 'year'
}
})Example
can use Example chart in the dist folder
Note: index-fa.html is for persian language