2.0.1 • Published 2 years ago
stackignite v2.0.1
stackignite
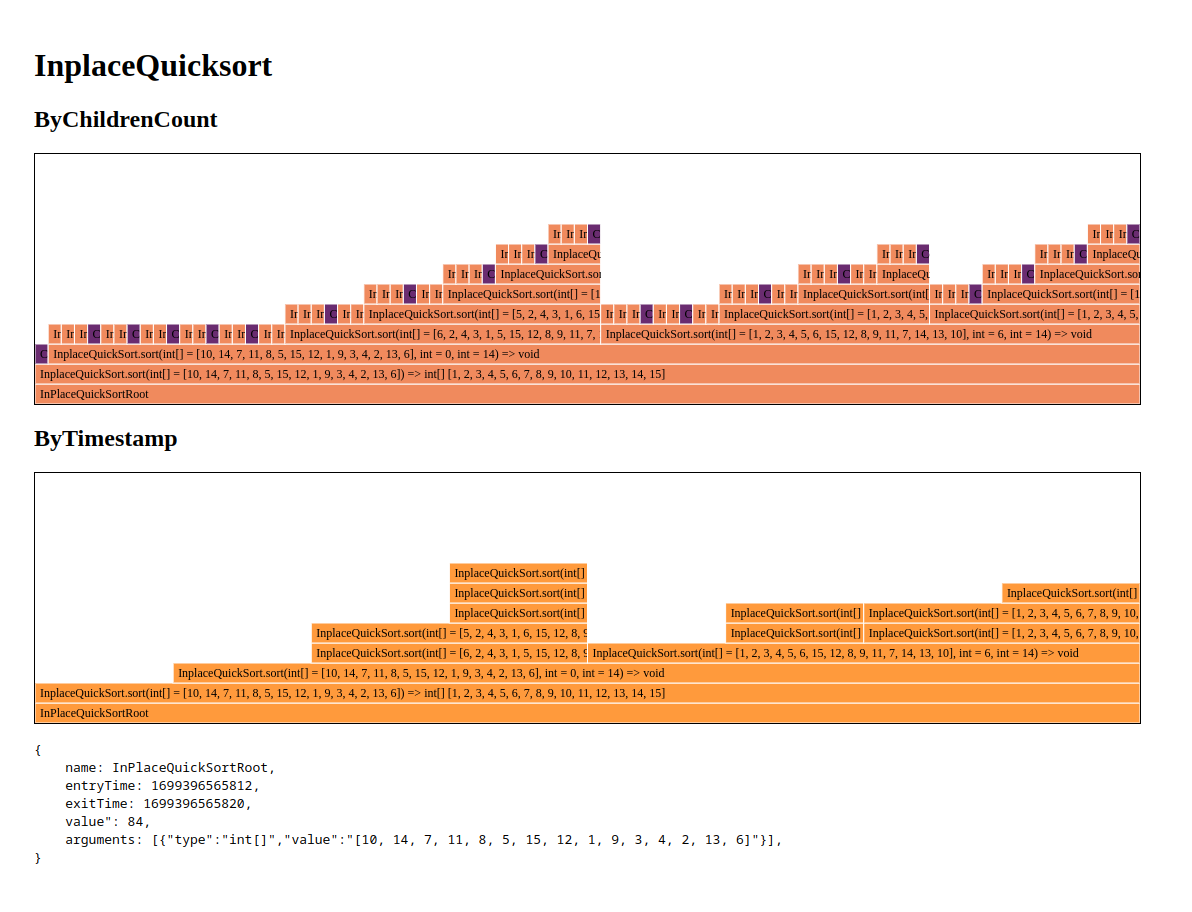
This is a Javascript implementation of a flamegraph focused on performance.

Features
- Rasterized rendering with canvas, you can right click and save as image.
- Bar size by timestamp or children count.
- Resizable, responsive.
- Customizable color palette. Palette can be changed at any time without reload data.
- Customizable tooltip.
- Instant zoom span on click (no animation).
Graph Types
- ChildrenCallCount: Count all children recursively for a span and gives the space according to the count. Useful if you want all entries to show up.
- Timestamp: Uses the fields "entryTime" and "exitTime" to place the spans. It will not show entries with interval of 0. Used for performance flamegraph.
Installation
npm i stackigniteUsage
Example:
<div id="inPlaceQuickSortByChildrenCount"></div>import { loadData } from './index.js';
const data = {
name: "A",
children: [
{
name: "AA"
},
{
name: "AB",
children: [
{name: "ABC"}
]
}
]
}
const handler = loadData({
elementId: "inPlaceQuickSortByChildrenCount",
data: data,
graphType: "ChildrenCallCount",
colorPalette: ["rgb(249, 237, 105)", "rgb(240, 138, 93)", "rgb(184, 59, 94)", "rgb(106, 44, 112)"], // optional
onClick: (n) => console.log(n), // optional
zoomOnClick: true, // optional
tooltip: (n) => `<span class="tt">${n.name}</span>`, // optional
});
// If you want to change the colors, rgb and hex is accepted
handler.changeColorPalette(["#FFBB5C", "#FF9B50", "#E25E3E", "#C63D2F"]);