testcafe-lighthouse-1 v1.0.8

Lighthouse Testcafe - NPM Package
Lighthouse is a tool developed by Google that analyzes web apps and web pages, collecting modern performance metrics and insights on developer best practices.
The purpose of this package is to produce performance report for several pages in connected mode and in an automated (programmatic) way.
Usage
Installation
You can have to add the testcafe-lighthouse library as a dependency (or dev-dependency) in your project
$ yarn add -D testcafe-lighthouse
# or
$ npm install --save-dev testcafe-lighthouse
In your code
After completion of the Installation, you can use testcafe-lighthouse in your code to audit the current page.
Step 1:
In your test code you need to import testcafe-lighthouse and assign a cdpPort for the lighthouse scan. You can choose any non-allocated port.
import { testcafeLighthouseAudit } from 'testcafe-lighthouse';

fixture(`Audit Test`).page('http://localhost:3000/login');

test('user performs lighthouse audit', async () => {
  await testcafeLighthouseAudit({
    cdpPort: 9222,
  });
});
Step 2:
Kick start test execution with the same cdpPort.
// headless mode, preferable for CI
npx testcafe chrome:headless:cdpPort=9222 test.js

// non headless mode
npx testcafe 'chrome:emulation:cdpPort=9222'  test.js
Thresholds per tests
If you don't provide any threshold argument to the testcafeLighthouseAudit command, the test will fail if at least one of your metrics is under 100.
You can make assumptions on the different metrics by passing an object as argument to the testcafeLighthouseAudit command:
import { testcafeLighthouseAudit } from 'testcafe-lighthouse';

fixture(`Audit Test`).page('https://angular.io/');

test('user page performance with specific thresholds', async () => {
  await testcafeLighthouseAudit({
    thresholds: {
      performance: 50,
      accessibility: 50,
      'best-practices': 50,
      seo: 50,
      pwa: 50,
    },
    cdpPort: 9222,
  });
});
If the Lighthouse analysis returns scores that are under the one set in arguments, the test will fail.
You can also make assumptions only on certain metrics. For example, the following test will only verify the "correctness" of the performance metric:
test('user page performance with specific thresholds', async () => {
  await testcafeLighthouseAudit({
    thresholds: {
      performance: 85,
    },
    cdpPort: 9222,
  });
});
This test will fail only when the performance metric provided by Lighthouse will be under 85.
Passing different Lighthouse config to testcafe-lighthouse directly
You can also pass any argument directly to the Lighthouse module using the second and third options of the command:
const thresholdsConfig = {
  /* ... */
};

const lighthouseOptions = {
  /* ... your lighthouse options */
};

const lighthouseConfig = {
  /* ... your lighthouse configs */
};

await testcafeLighthouseAudit({
  thresholds: thresholdsConfig,
  opts: lighthouseOptions,
  config: lighthouseConfig,

  /* ... other configurations */
});
Generating HTML audit report
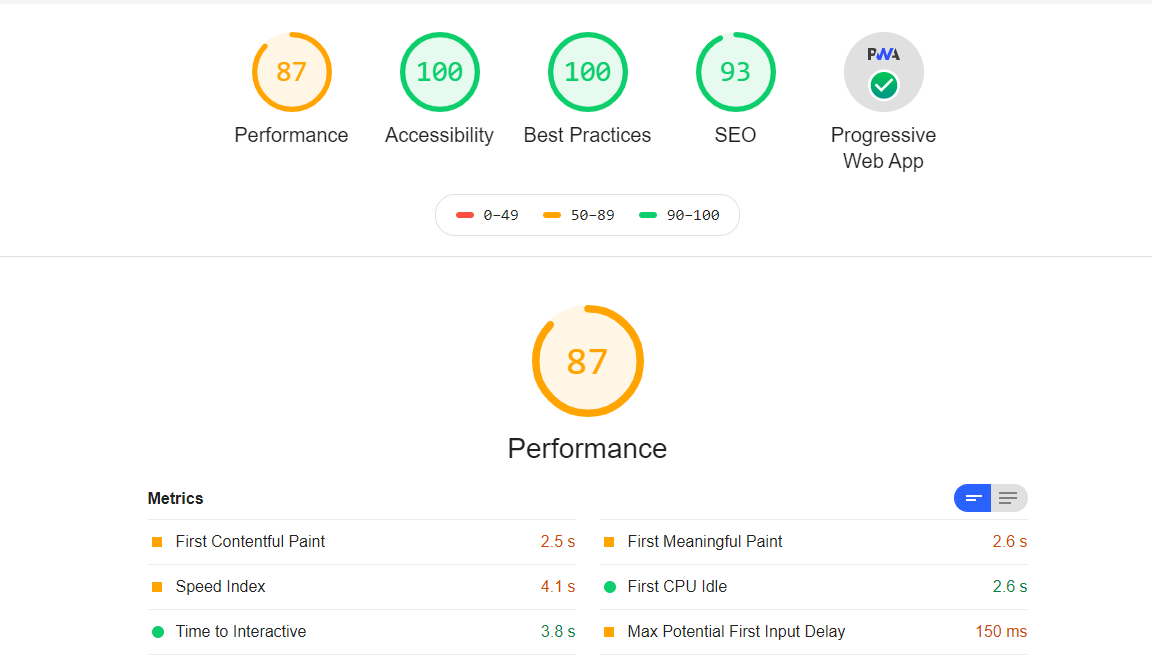
testcafe-lighthouse library can produce very famous Lighthouse HTML audit report, that you can host in your CI server. This report is really necessary to check the detailed report.
await testcafeLighthouseAudit({
  /* ... other configurations */

  htmlReport: true, //defaults to false
  reportDir: `path/to/directory`, //defaults to `${process.cwd()}/lighthouse`
  reportName: `name-of-the-report`, //defaults to `lighthouse-${new Date().getTime()}.html`
});
This will result in below HTML report

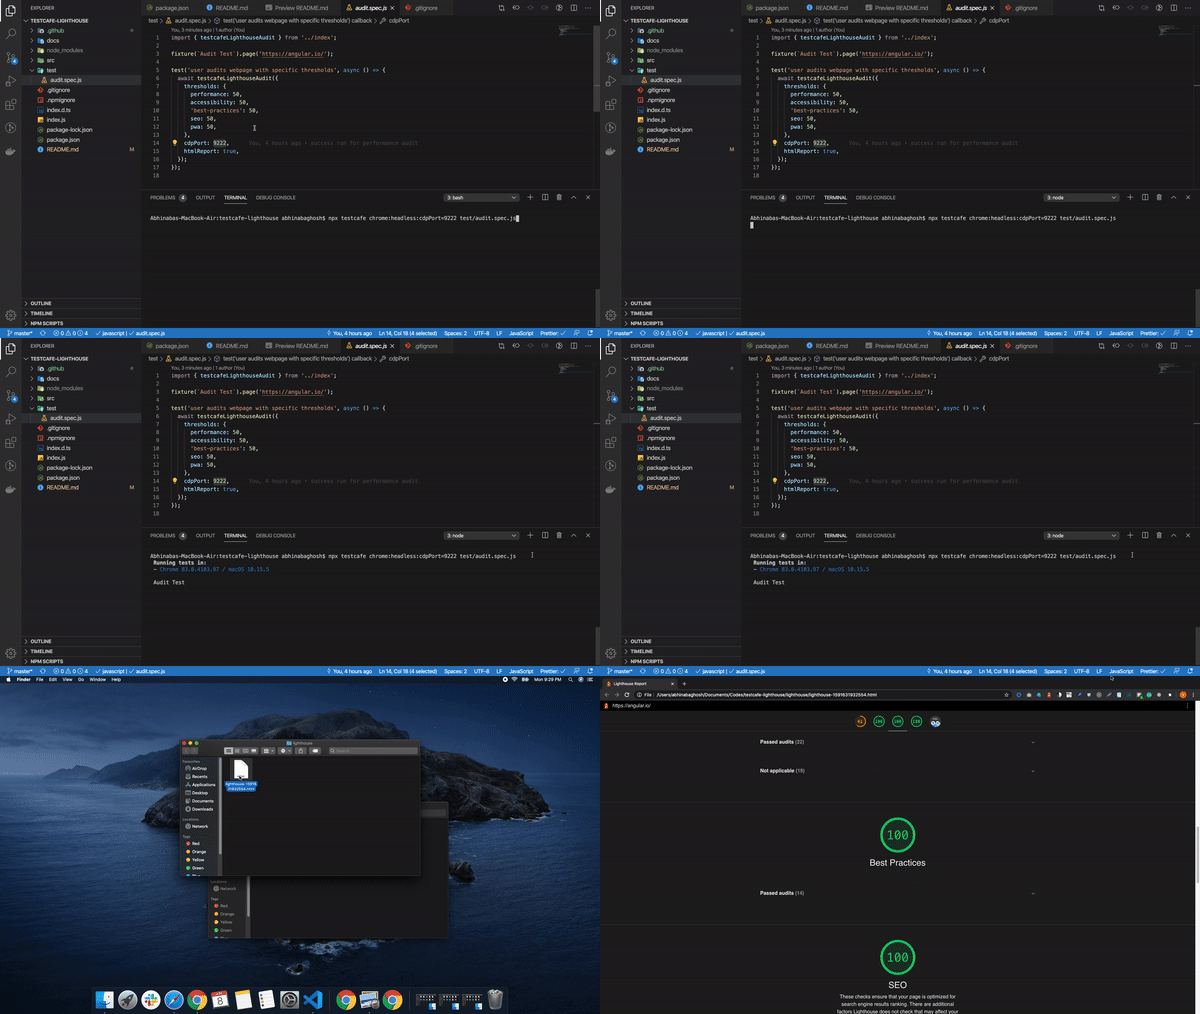
Demo

Tell me your issues
you can raise any issue here
Before you go
If it works for you , give a Star! :star:
- Copyright © 2020- Abhinaba Ghosh


