thundra-trace-chart-css v1.1.1
Thundra-Trace-Chart
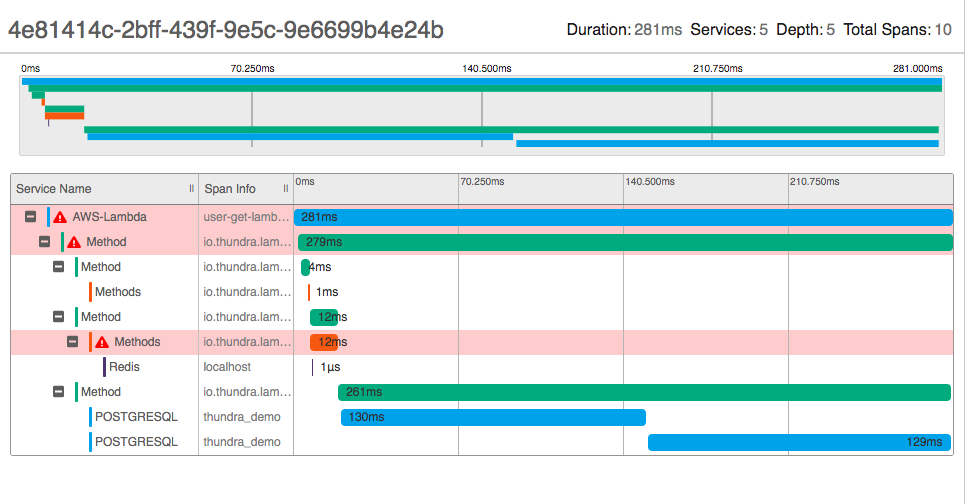
thundra-trace-chart is a React component to render open-tracing compatible traces and spans in a similar way to popular tools like Jeager and Zipkin. This component is using the project zipkin-lens in its roots.

This component is under development and may not be the best solution for a custom use case. So you may want to fork it, or we would be happy to accept your PR's.
For npm audit logs to save use this command;
npm audit --no-unicode --no-color > "npm-audit-log-$(date +%s).txt"
tl;dr
- Install by executing
npm install --save thundra-trace-chartoryarn add thundra-trace-chart. - Import by adding
import ThundraTraceChart from 'thundra-trace-chart'. - Use by adding
<ThundraTraceChart {...someProps} />.
Demo
Minimal demo page is included in sample directory. You just need to clone the repo and run npm i then finally run npm start to see the demo on your machine.
Online demo will be available soon!
Installation
Add Thundra-Trace-Chart to your project by executing npm install --save thundra-trace-chart or yarn add thundra-trace-chart.
Usage
Here's an example of basic usage:
import React, { Component } from 'react';
import ThundraTraceChart from 'thundra-trace-chart';

class MyApp extends Component {

  sampleTrace = () => {
    let trace = [
      {
        traceId: '4e81414c-2bff-439f-9e5c-9e6699b4e24b',
        parentId: '',
        id: '9400a8a9-9650-4312-9514-d4bbc1114a97',
        name: 'user-get-lambda-java-es',
        timestamp: 1557761782905000,
        duration: 281000,
        serviceName: 'AWS-Lambda',
        tags: {
          error: true
        }
      }
    ]

    return trace;
  }

  render() {
    return (
      <div>
        <ThundraTraceChart
          traceId="4e81414c-2bff-439f-9e5c-9e6699b4e24b"
          traceSummary={this.sampleTrace()}
        />
      </div>
    );
  }
}
User guide
Props
Trace Object
Each of the trace object provided to traceSummary array has its own special structure.
| Key name | Type | Description |
|---|---|---|
| traceId | string | Common trace id to all spans. |
| parentId | string | Parent span id of the span. |
| id | string | Unique id of the span. |
| serviceName | string | Name to be showed under Service Name column. |
| name | string | Info to be showed under Span Info column. |
| timestamp | number | Time info in microseconds to show when span is started. |
| duration | number | Duration of the span. |
| color | string | Color string as a valid hexcode. |
| tags | object | Any extra info to provided to the span, i.e: error |
License
3 years ago
