1.0.4 • Published 7 years ago
tplot v1.0.4
tplot
Tired of using watch for watching numbers in the terminal?
e.g watch "ls | wc -l"
Tired of calculating the decrease rate of items in queue over and over again?
Trends? Throughput? Time left to zero?
tplot is the answer!
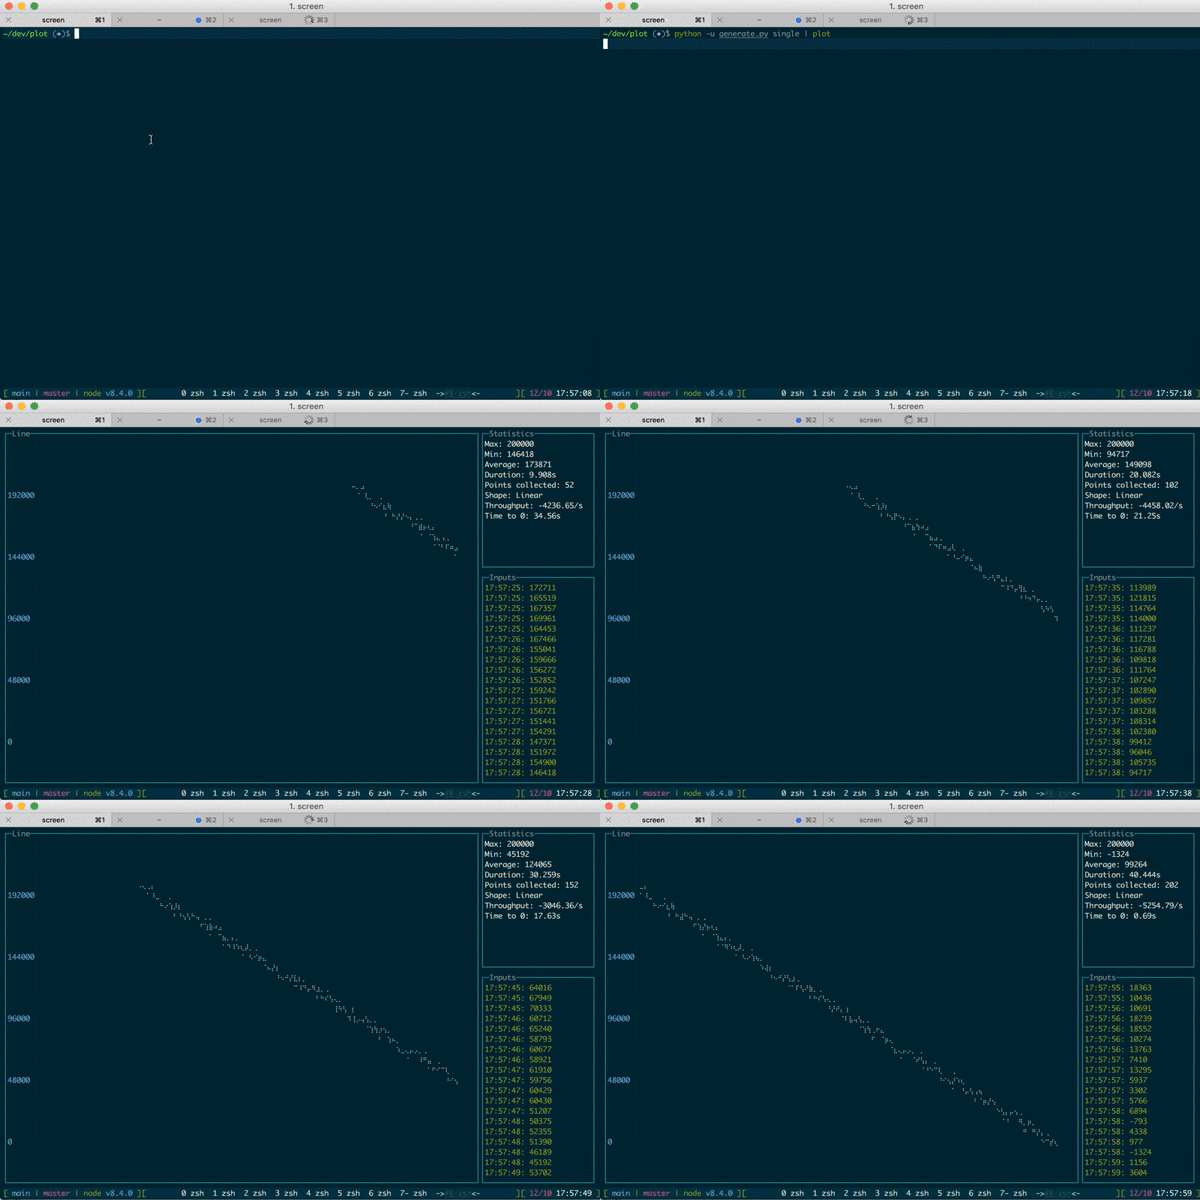
tplot is a modular nodejs cli that reads metrics from lots of inputs and plots it in the terminal!
In addition to the line chart you can see more stats about the series.
Stats:
tplot is trying to guess the slope of the line using linear regression
| name | explain |
|---|---|
| Max | Maximum point (since launch) |
| Min | Minimum point (since launch) |
| Average | Average value of all points |
| Points collected | Amount of points collected (since launch) |
| Shape | Linear / non-linear |
| Throughput | If shape is linear presents the throughput based on line's slope |
| Time to ${program.goal} | The approximate time remained to the gaol (defaults to 0) |
Available plugins
- redis
- sqs
- stdin
- command
Examples:
Read numbers from stdin
command | tplot stdin
Run command periodically and plot the output
tplot cmd 'echo $RANDOM'
Plot the number of files in the directory
tplot cmd 'ls|wc -l'
Plot redis list length
tplot redis -h myserver events'
Usage:
  Usage: tplot [options] [command]


  Options:

    -V, --version               output the version number
    -t, --title [title]         Set the title
    -p, --points [n]            Set the maximum number of points to show in the screen (default:100)
    -g, --goal [n]              If looking at an linear line, set the goal you wish the line will get (default:0)
    -r, --regressionPoints [n]  Set the numbers of points to collect in order to calculate the throughput (default:16)
    -h, --help                  output usage information


  Commands:

    cmd|c [options] <command>  Monitor shell command output
    stdin|s                    Monitor stdin
    redis|r [options] <list>   Monitor redis list length
Installation:
via npm:npm install -g tplot
via docker:
docker pull mosheza/tplot
docker run -it mosheza/tplot -c 'echo 1'
via source:
git@github.com:moshe/tplot.git
cd tplot
npm install --link