tree-visualizer v1.0.1
tree-visualizer
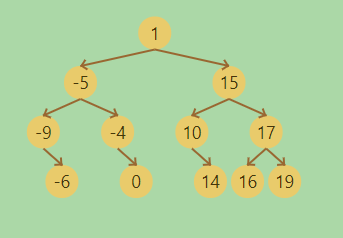
tree-visualizer can visualize tree structures(BST).
Optionally, you can also visualize linked list structure.
Example
BST:
1,-5,15,-9,-4,10,17,null,-6,null,0,null,14,16,19=>

See demo
Singly Linked List
1,-5,15,-9,-4,10,17,-6,0,14,16,19=>

Singly Linked List
1,-5,15,-9,-4,10,17,-6,0,14,16,19=>

Getting Started
Prerequisites
tree-visualizer uses anime.js
Usage
Via npm
$ npm install treeVisualizerimport treeVisualizer from "./node_modules/tree-visualizer/src/tree-visualizer.es.js";Or link directly
<script src="https://unpkg.com/tree-visualizer/src/tree-visualizer.js"></script>
<script src="https://unpkg.com/animejs@3.2.1/lib/anime.min.js"></script>
Hello World
<div id="targetDiv"></div>let targetFn = treeVisualizer(
{target:"targetDiv"}
)
targetFn.drawData(
[{
data:"[1,-5,15,-9,-4,10,17,null,-6,null,0,null,14,16,19]"
}]
)Option
####DataType The default is a tree structure, but LinkedList can also be visualized.
let targetFn = treeVisualizer(
    {
        target:"targetDiv",
        dataType:"SinglyLinkedList"// or "DoublyLinkedList"
    }
)
targetFn.drawData(
    [{
        data:"[1,-5,15,-9,-4,10,17,null,-6,null,0,null,14,16,19]"
    }]
)
Set Information
If you want the text to be displayed along with the animation, you can write the following
let targetFn = treeVisualizer(
    {target:"targetDiv"}
)
targetFn.drawData(
    [{
        data:"[1,-5,15,-9,-4,10,17,null,-6,null,0,null,14,16,19]"
    }],`<strong>You can write html here</strong>`
)
Animation
If you want to run animation, set animation to true and connect it with nextStep. tree-visualizer animates the difference.
let targetFn = treeVisualizer(
    {
        target:"targetDiv",
        animation:true
    }
)
targetFn.drawData(
    [{
        data:"[1,-5,15,-9,-4,10,17,null,-6,null,0,null,14,16,19]"
    }],`1st step`
)
targetFn.nextStep(
    [{
        data:"[1,-5,15,-9,-4,10,17,null,-6,8,0,null,14,16,19]"
    }],`2nd step`
)
If you have duplicate Data, please set the ID.
let targetFn = treeVisualizer(
    {
        target:"targetDiv",
        animation:true
    }
)
targetFn.drawData(
    [{
        data:"[1,1,1,null,1,1]",
        ID:"[0,1,2,3,4,5]"
    }],`1st step`
)
targetFn.nextStep(
    [{
        data:"[1,1,1,null,1,1]",
        ID:"[1,0,2,3,5,4]"
    }],`2st step`
)
Animation Settings
You can change configuration.
let targetFn = treeVisualizer(
    {   target : "targetDiv",
        animation: true,// default: false
        boxColor :'rgb(233,203,107)',//default:'rgb(233,203,107)'
        textColor : 'rgb(69,54,10)',//Only rgb() default:'rgb(69,54,10)'
        arrowColor : 'rgb(153,103,49)',//Only rgb() default: 'rgb(153,103,49)'
        interval : 2000,// ms default: 2000
        boxSize : 30,// px default:30
        boxXMargin: 30,// px default 30
        boxYMargin: 45,// px default 45
    }
)
targetFn.drawData(
    [{
        data:"[1,-5,15,-9,-4,10,17,null,-6,null,0,null,14,16,19]"
    }],`1st step`
)
targetFn.nextStep(
    [{
        data:"[1,-5,15,-9,-4,10,17,null,-6,8,0,null,14,16,19]"
    }],`2nd step`
)
Node Settings
You can change the color for each node. By using nextStep, you can animate the color change as well.
let targetFn = treeVisualizer(
    {target:"targetDiv"}
)
targetFn.drawData(
    [{
        data:"[1,2,3,4]",
        boxColor:"[rgb(0,97,59),rgb(0,97,59),rgb(0,97,59),rgb(0,97,59)]",
        textColor:"[rgb(255,255,0),rgb(255,0,0),rgb(255,0,0),rgb(255,0,0)]"
    }]
)
Separate Tree
You can also display multiple trees.
let targetFn = treeVisualizer(
    {target:"targetDiv"}
)
targetFn.drawData(
    [{
        data:"[1,2,3,4]"
    },
    {
        data:"[5,6,7,8]"
    }
    ]
)
Author
mail to: nori.ut3g@gmail.com
License
"tree-visualizer" is under MIT license