urban_graph v1.2.0
This project was bootstrapped with Create React App.
Urban Graph
A React component that abstracts painstaking graph creation into a single class with easy-to-use props and a variety of customisation possiblities.
Installation
Use npm i urban_graph --save to install and save the package.
Usage
import UrbanGraph from 'urban_graph'

const _data = [
    { id: 1, lastName: 'Snow', firstName: 'Jon', age: 35, gender: "male", hourServed: 24, email: "sample@gmail.com", skills:["IT", "Finance", "Art"] },
    { id: 2, lastName: 'Lannister', firstName: 'Cersei', age: 42, gender: "female",  hourServed: 22, email: "sample@gmail.com", skills:["Teaching", "Art"] },
    ...,
    { id: 9, lastName: 'Roxie', firstName: 'Harvey', age: 65,gender: "male", hourServed: 100, email: "sample@gmail.com", skills:["Finance", "Teaching"] },
  ];
const _argumentAxis = "firstName" //this attribute's value will be the x-axis of the graph
const _seriesList = ["age", "hoursServed"] //list of attribute names that should be plotted on the graph
const _title = "GoT Volunteer Work"
const _graphType = "bar" //other options included in Options description

class ABC extends React.Component {
    render(){
        return <UrbanGraph data={_dataList} graphType={_graphType}
            seriesList={_listOfSeries} colourTheme="Bright" argumentAxis={_argumentAxis} title={_title}
            export/>
    }

}
Options
- title is the title of the graph (string)
- data is the list of data objects that the graph will be built on (list of objects)
- graphType is the type of the graph (e.g - 'bar', 'line', 'spline', 'stackedBar', 'area', 'pie', 'doughnut')
- seriesList is the list of data attributes to plot on the graph (list of string)
- argumentAxis is the x-axis of a line graph, or the identifying attribute for each data-point (string)
- aggregate can be added as a bool prop to aggregate data by values and report number of instances
- export can be added as a bool prop to make the graph exportable as PNG/PDF/SVG/JPEG
- crosshair can be added as a bool prop to add crosshairs (lines connecting to both axes) to the graph
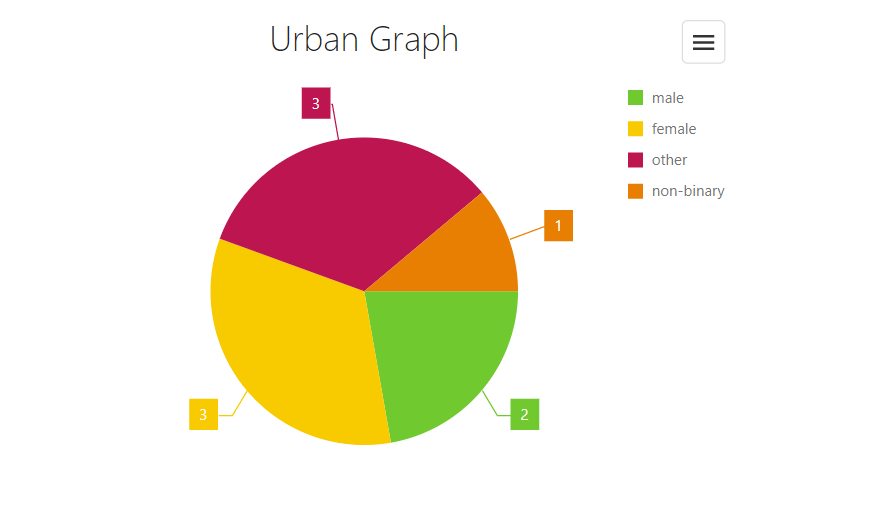
In a pie-chart, if the seriesList contains a key with non-numeric values, UrbanGraph will count the number of occurrences of each unique value and display the number as the value, and the attribute as the argument axis. If aggregate is selected, even numeric values will be counted based on values. Italicised graph types are pie-like graphs
Example
The above code gives the following graph... all graphs are made from the same data set shown in Usage section

Aggregated x-y chart

Pie charts with numeric attribute value

Pie charts with non-numeric attribute value

5 years ago
5 years ago
5 years ago
5 years ago
5 years ago
5 years ago
5 years ago
5 years ago
5 years ago
5 years ago
5 years ago
5 years ago
5 years ago
5 years ago