1.2.7 • Published 8 years ago
videoplot v1.2.7
Install
Prerequisites
Having ffmpeg installed on your computer see fluent-ffmpeg prerequisites
For ubuntu, you should also do
sudo apt-get install libgif-devNpm installation
npm install videoplotExample
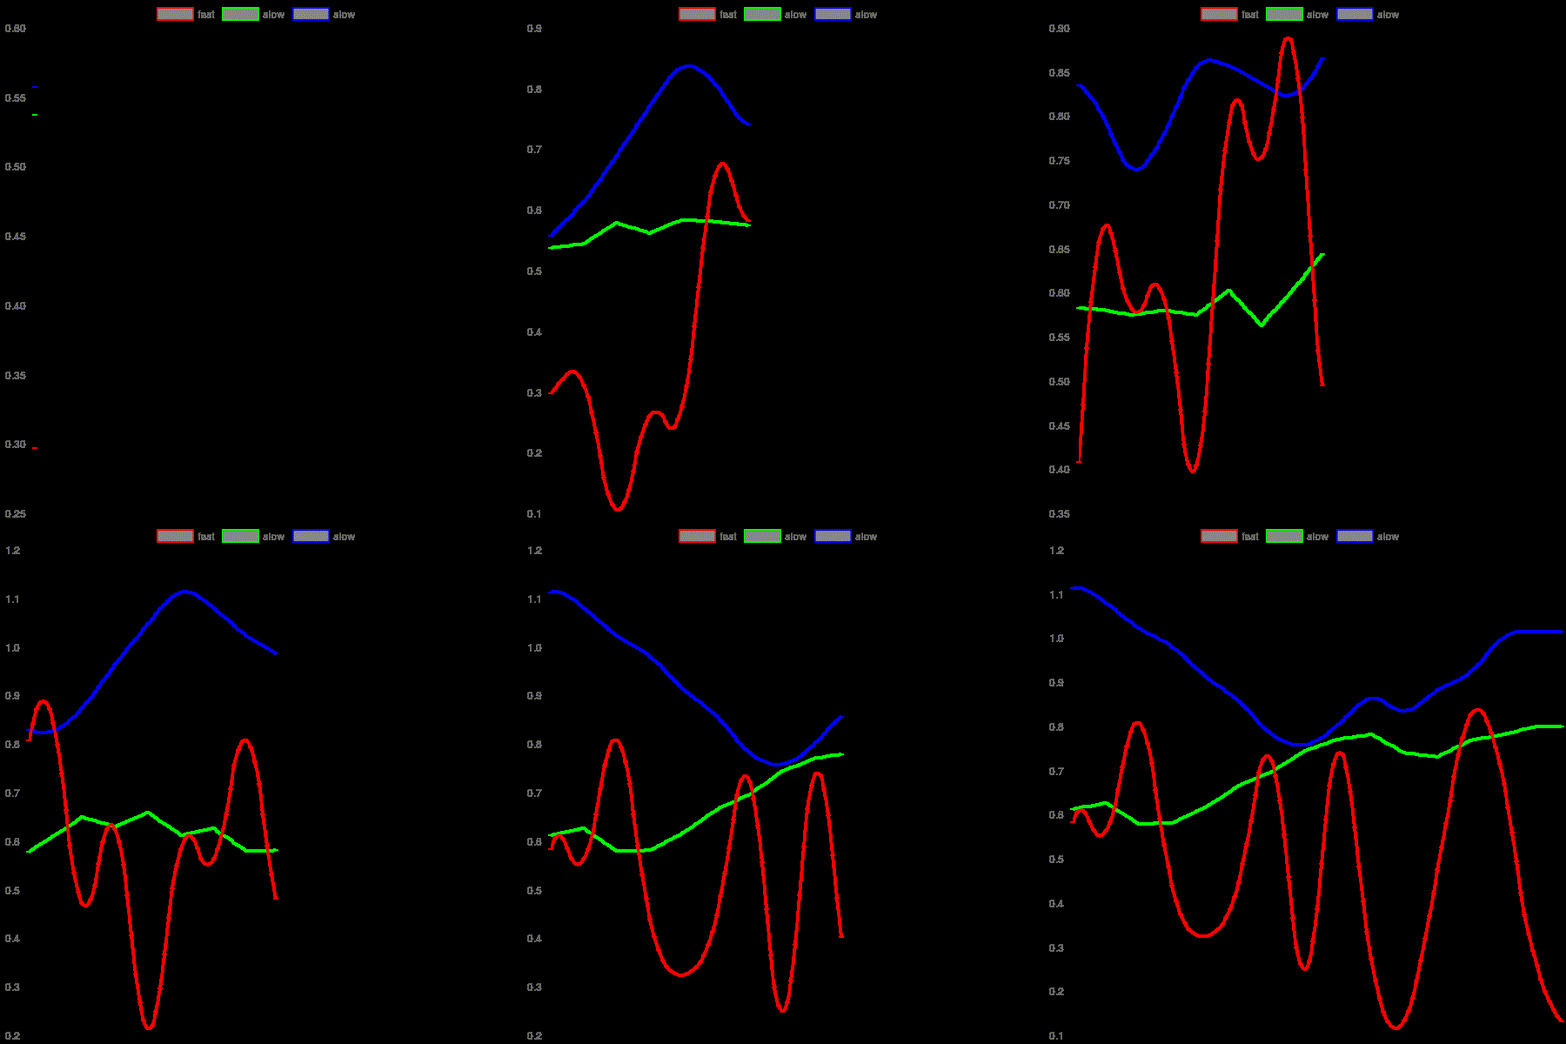
| First example (1 simple curve) | Second example (3 curves) |
|---|---|
 |  |
Usage
const Videoplot = require('videoplot');

var plot = new Videoplot({ w:600, h:600, duration: 30, fps: 8 });

// create random data
const y = [];
for(var i = 0; i< 10; i++){
	y.push(Math.random());
}

// chartjs dataset format

const datasets = [];
datasets.push({
	label : "graph",
	borderColor: "#FFFFFF",
	backgroundColor: "#888888",
	fill: false,
	data : y
});

// chartjs dataset format
plot.drawVideoChart({
		type: 'line',
		wScale: 4,
		data: {
			datasets : datasets
		},
		options: {
			elements: {
				point : {
					pointStyle : 'line'
				}
			},
			scales: {
				xAxes: [{
					ticks: {
						display: false
					}
				}],
				yAxes: [{
					ticks: {
						display: false,
						beginAtZero: true,
						suggestedMax: 1
					}
				}],
			}
		}
})
.then(() => {
	console.log("Chart is created");
	// chart is created
	return plot.writeVideoToFile({filename: './examples/example.gif'});
	//return plot.getVideoStream('image/gif');
})
.catch(err => {
	console.error("Error : ", err)
})
.then(() => {
	console.log("Chart is saved into ./examples/example.gif");
})
Documentation
Documentation is inside the code as JSDoc.
TO DO
- better x scale management (labels ...)
- more chartjs options handling
- video output handling
Thanks
Thanks to fluent-ffmpeg and chartjs-node