vidi-graph-gl v0.1.18

Table of Contents
About The Project
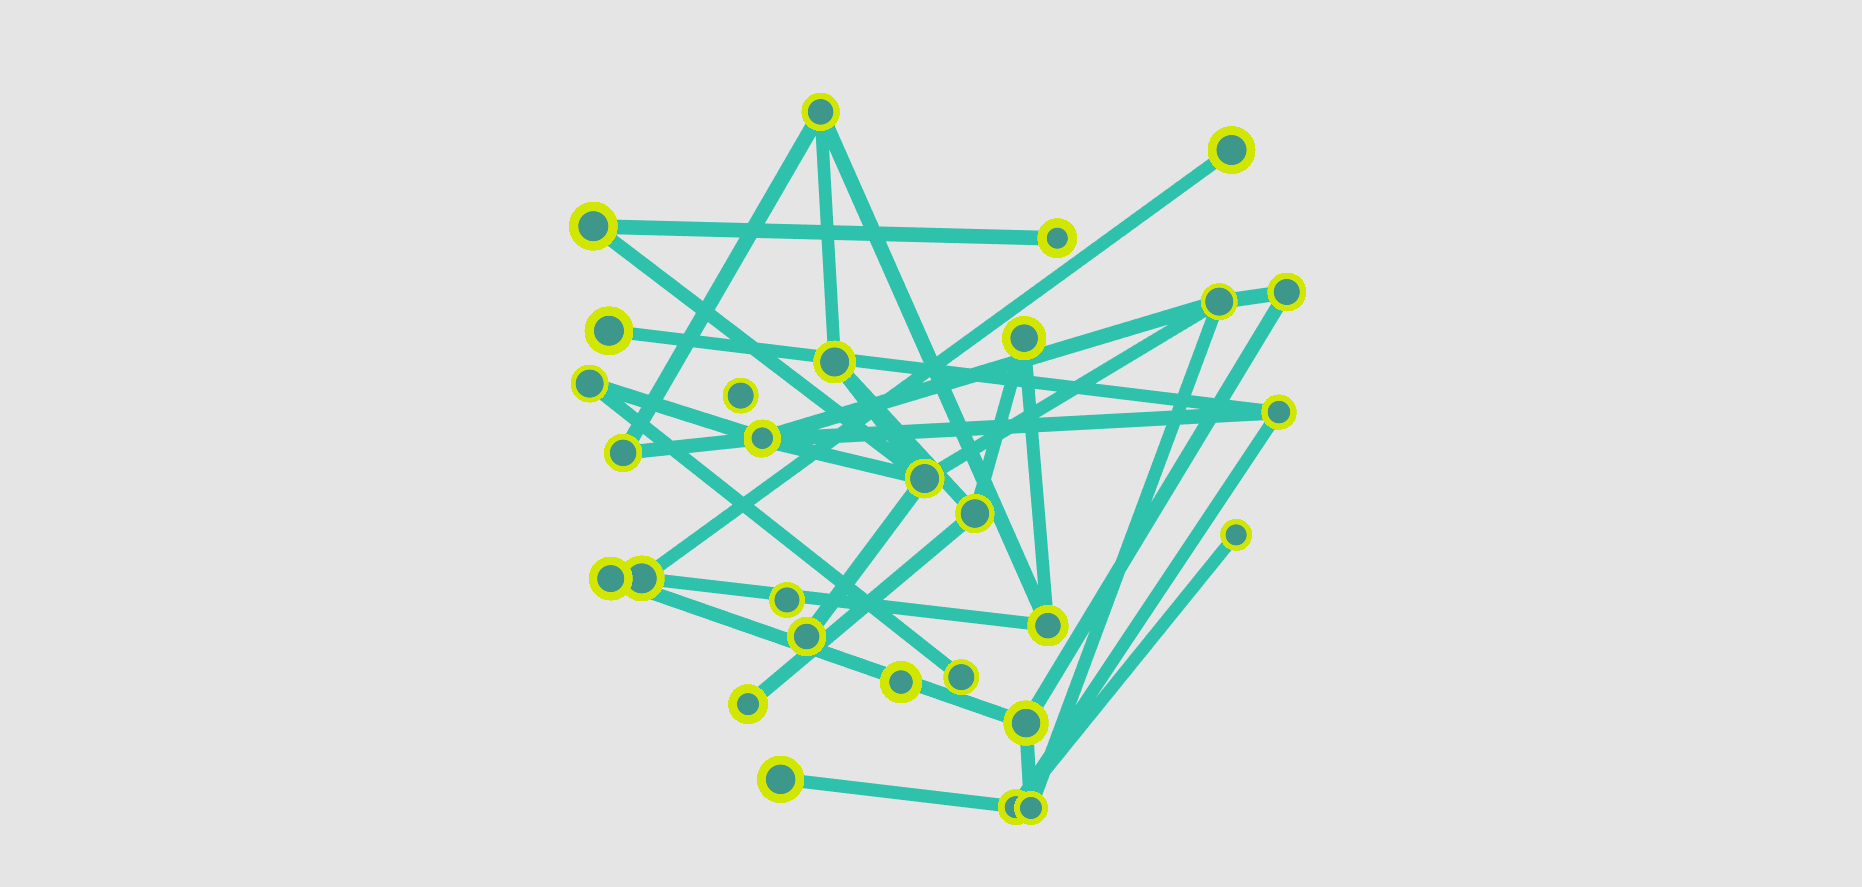
Graph-gl is a minimum package dedicated to render graphs and handel interactions based on WebGL.
Built With
Notification
Check out npm or github release branch for latest version.
The interaction feature is under development and will be released very soon.
Getting Started
To get a local copy up and running follow these simple steps.
Prerequisites
This is an example of how to list things you need to use the software and how to install them.
- npm
npm install npm@latest -gInstallation
Using the lib
The library could be installed with
npm install vidi-graph-glDevelop the lib
- Clone the repo
git clone https://github.com/haicatw/graph-gl.git- Install NPM packages
npm install- Lint
npm run lint- Build
npm run buildUsage
Import the library
import GraphGL from "vidi-graph-gl";Initialize the instance
const graphGLInstance = new GraphGL({ selector: "#container" });Load your graph
const myGraph = {
    nodes: [
        { id: 0, x: 0, y: 0, size: 40, label: "testing..." },
        { id: 1, x: 3.4, y: -5.2, size: 30, borderWidth: 10, label: "testing" },
        { id: 2, x: 0, y: 10, size: 30, borderWidth: 30, label: "testing label"},
    ],
    edges: [{ id: 0, source: 2, target: 1, color: "#2ec1ac", width: 1 }],
};
graphGLInstance.readGraph(myGraph);
Update visualization
graphGLInstance.refresh();Update graph data
for(const node of graphGLInstance.nodes()) { // or .edges() for updating edges
    node.color = '#000000'
    node.borderWidth = 40
    node.opacity = 0.5
    node.borderColor = '#2ec1ac'
    node.size = 40
    node.label = "new label"
}
graphGLInstance.refresh();
Clear current graph data
graphGLInstance.clear();
Roadmap
See the open issues for a list of proposed features (and known issues).
Features
- Graph model
- Node visual encoding
- Edge visual encoding
- Curved edge
- Auto fit scene
- Label
- Interaction handler
- Graph hot updator
Contributing
Contributions are what make the open source community such an amazing place to be learn, inspire, and create. Any contributions you make are greatly appreciated.
- Fork the Project
- Create your Feature Branch (
git checkout -b feature/AmazingFeature) - Commit your Changes (
git commit -m 'Add some AmazingFeature') - Push to the Branch (
git push origin feature/AmazingFeature) - Open a Pull Request
License
Distributed under the MIT License. See LICENSE for more information.
5 years ago
5 years ago
5 years ago
5 years ago
5 years ago
5 years ago
5 years ago
5 years ago
5 years ago
5 years ago
5 years ago
5 years ago
5 years ago
5 years ago
5 years ago
5 years ago
5 years ago
5 years ago
5 years ago