vue-d3-barchart v0.0.28
vue-d3-barchart
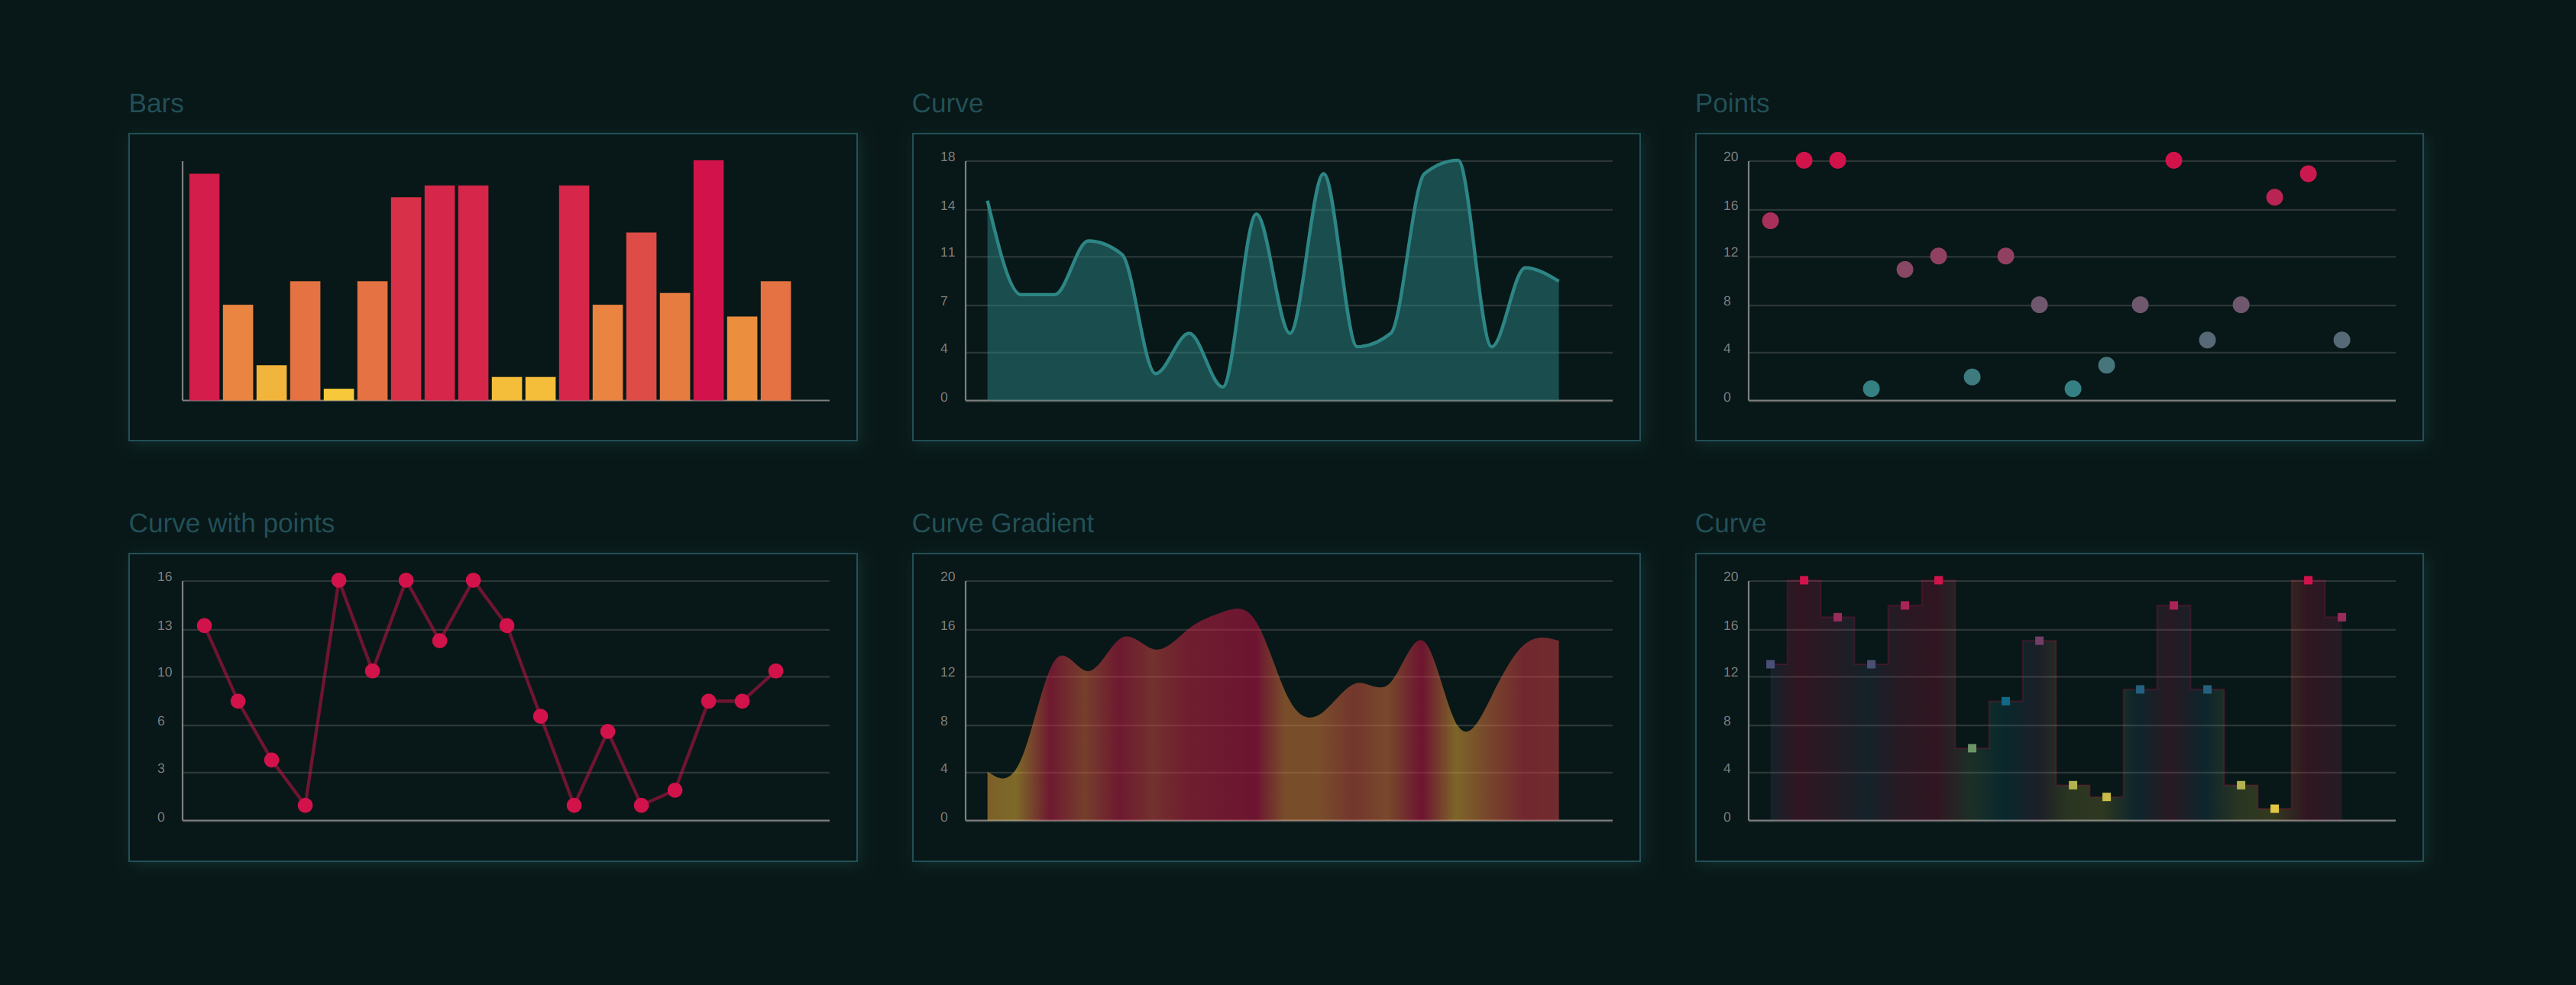
Small component to draw charts using d3 v4

Demo
Installation
npm install vue-d3-barchart --saveUsage
  ...
  <d3-barchart :data='data' :options='options'/>
  ...
import D3BarChart from 'vue-d3-barchart'
...
components: {
D3BarChart
},
....<style src="vue-d3-barchart/dist/vue-d3-barchart.css"></style>Or: import source component from: 'vue-d3-barchart/src/vue-d3-barchart.vue' And install devDependencies. (d3-scale, stylus and pug) See: package.json)
Props
data: Array of values or objects (see options: getX,getY)
options:
- size:{w,h}
- getX: function(d)
getY: function(d)
labels: Boolean show axis labels
axis: { valuesY:Boolean, valuesX:boolean, linesX:boolean, linesY:boolean } render axis
- axisTicks
padding: 0.1 bar padding
colors: Array | Object
- Array: (range) maxValueColor, minValueColor
- Object { key(value): color} , max values first
colorInterpol: Function | name of D3 function
- colorScale: Function | name of D3 function (colorInterpol Overrides this option)
colorCb: Color Function: (x,d) => {return color}, Overrides colorScale and colorInterpol
line: Boolean render line
formatX: Function(x) --> x
- formatY: Function(y) --> y
- formatLabel(d, formatX, formatY) -> , one value per line: String | Object: {style,css,txt}
default:
      formatLabel (bar, formatX, formatY) {
        return [
          'x: ' + formatX(bar.xv),
          'y: ' + formatY(bar.yv)
        ]
},bars: Boolean : show bars | Object:
- gradient: Boolean | Object : { sroke:Boolean, fill:Boolean }
curve: Boolean | Object:
type: String | Function
String, name of d3 curve Types ex: 'linearClosed' or 'curveLinearClosed' (default: MonotoneX) see d3-shape#curves
Fuction: custom curve function
style: Object: {css-prop: value}
- gradient: Boolean | Object : { sroke:Boolean, fill:Boolean }
- close: Boolean, close curve to chart limits
curveBack: render another curve, with same settings as default.
marks: Boolean | Object: {type: point | square style:{ fill , stroke }, size }
domain Object: {max:number,min:number The domain values are auto calculated from data, but for example,if you want a chart that start from zero you can pass the domain option as: {min:0}
d object
- xv: original x value
- yv: original y value
- x: computed chart x value
- y: computed chart y value
- color: computed chart color
- percentX: percent of x
- percentY: percent of y
- w: computed bar width,
- d: original data
Events
- barClick: fired on click/touch bar, emits bar,event
Dependencies
- d3-scale
- d3-array
- d3-shape
5 years ago
6 years ago
6 years ago
6 years ago
7 years ago
7 years ago
7 years ago
7 years ago
7 years ago
7 years ago
8 years ago
8 years ago
8 years ago
8 years ago
8 years ago
8 years ago
8 years ago
8 years ago
8 years ago
8 years ago
8 years ago
8 years ago
8 years ago
8 years ago


