1.1.9 • Published 6 years ago
vue-draw-xs v1.1.9
vue-draw-xs

可视化图表开发组件
该组件通过JSON数据渲染图表页面
快速开始
- 安装
npm install vue-draw-xs- 注册
在main.js中,对组件进行全局注册
import Xsc from 'vue-draw-xs'
Vue.use(Xsc)
3.使用
<template>
  <div id="helloWorld">
    <Xsc ref="xsc" :charts="charts" :options="options"></Xsc>
  </div>
</template>

<script>
export default {
  name: 'App',
  data () {
    return {
      options: {'name': 'vue-draw-xs', 'width': 800, 'height': 600, 'backgroundColor': '#FFFFFF', 'backgroundImage': null, 'backgroundSize': null, 'backgroundRepeat': null, 'theme': 'light', 'baseUrl': 'http://xsCollect.isaacxu.com/xsCollect/api/chart', 'id': 1561974300538},
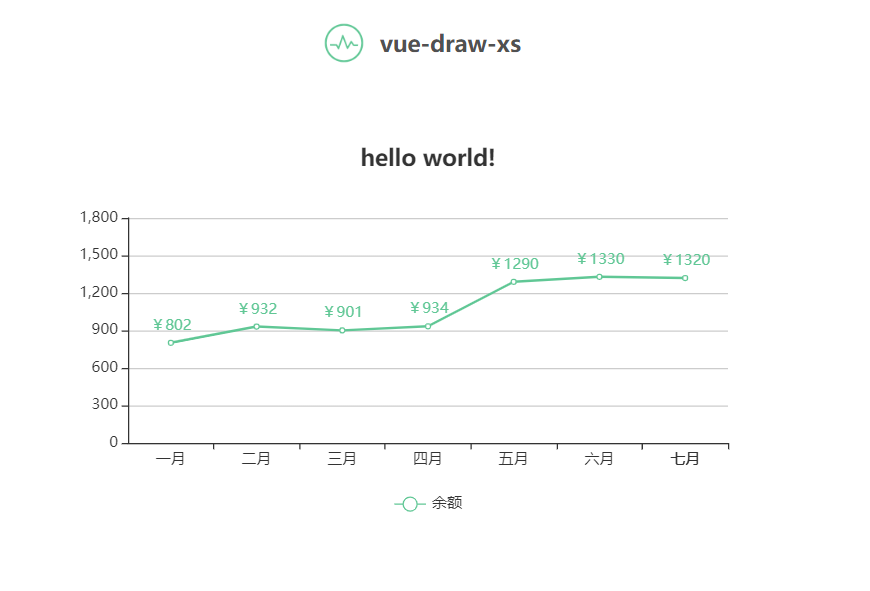
      charts: [{'id': 1561974315840, 'type': 'dom', 'chart': 'img', 'config': {'box': {'width': 40, 'height': 40, 'x': 304, 'y': 36, 'zIndex': 100}, 'type': 'img', 'theme': 'light', 'options': {'src': 'http://7u.isaacxu.com/vue-draw-xs.png'}}}, {'id': 1561975902768, 'type': 'dom', 'chart': 'text', 'config': {'box': {'width': 116, 'height': 40, 'x': 351, 'y': 36, 'zIndex': 100}, 'type': 'text', 'theme': 'light', 'options': {'text': {'fontFamily': '微软雅黑', 'content': 'vue-draw-xs', 'fontSize': 18, 'color': null, 'fontWeight': 'bold'}, 'boxSpace': {'lineHeight': 40, 'textAlign': 'center'}, 'background': {'color': null}, 'border': {'width': 0, 'style': 'solid', 'color': null}}}}, {'id': 1562138396445, 'type': 'eCharts', 'chart': 'line', 'config': {'box': {'width': 600, 'height': 300, 'x': 91, 'y': 136, 'zIndex': 100}, 'theme': 'light', 'options': {'title': {'text': 'hello world!', 'subtext': '', 'textStyle': {'fontStyle': 'normal', 'fontWeight': 'bold', 'fontSize': 18, 'lineHeight': 18}, 'subtextStyle': {'fontStyle': 'normal', 'fontWeight': 'normal', 'fontSize': 12, 'lineHeight': 12}, 'x': 'center', 'show': true}, 'tooltip': {'trigger': 'axis', 'formatter': '{a} <br/>{b} : ¥{c}', 'axisPointer': {'type': 'shadow'}, 'show': true}, 'xAxis': {'type': 'category', 'data': ['一月', '二月', '三月', '四月', '五月', '六月', '七月'], 'show': true, 'axisLabel': {'fontSize': 12, 'interval': 0}, 'axisLine': {'lineStyle': {}}, 'min': null, 'max': null}, 'legend': {'data': ['余额'], 'show': true, 'x': 'center', 'y': 'bottom', 'textStyle': {}}, 'yAxis': {'type': 'value', 'show': true, 'axisLabel': {'fontSize': 12, 'interval': 0}, 'axisLine': {'lineStyle': {}}, 'splitLine': {'lineStyle': {}}, 'min': '0', 'max': '1800'}, 'series': [{'name': '余额', 'data': [802, 932, 901, 934, 1290, 1330, 1320], 'type': 'line', 'itemStyle': {'color': '#60C795'}, 'label': {'show': true, 'formatter': '¥{c}', 'fontSize': 12, 'fontWeight': 'normal', 'position': 'top'}}]}, 'data': {'coordinate': 'rightAngle', 'loop': true, 'interval': 30, 'source': [{'type': 2, 'sql': '', 'json': '[{"month":"一月","value":802},\n{"month":"二月","value":932},\n{"month":"三月","value":901},\n{"month":"四月","value":934},\n{"month":"五月","value":1290},\n{"month":"六月","value":1330},\n{"month":"七月","value":1320}]', 'x': 'month', 'y': 'value', 's': '余额', 'xto': 'xAxis/data', 'yto': 'series/0/data', 'sto': ['legend/data/0', 'series/0/name']}]}}}]
    }
  }
}
</script>

<style scoped>

</style>
API
属性
| 属性 | 说明 | 类型 | 默认值 |
|---|---|---|---|
| options | 画布配置JSON | Array | null |
| charts | 画布中图表配置JSON | Object | null |
| view | 是否view模式 | Boolean | true |
方法
| 方法名 | 说明 | 参数 |
|---|---|---|
| update | 异步方法、 更新画布中的图表数据 | id (Number) 图表在画布中id |
| getData | 异步方法、 获取图表数据 | id (Number) 图表在画布中id |
| getDataConf | 获取图表的数据源配置 | id (Number) 图表在画布中id |
1.1.9
6 years ago
1.1.8
6 years ago
1.1.7
6 years ago
1.1.6
6 years ago
1.1.5
6 years ago
1.1.4
6 years ago
1.1.3
6 years ago
1.1.2
6 years ago
1.1.1
6 years ago
1.1.0
6 years ago
1.0.9
6 years ago
1.0.8
6 years ago
1.0.7
6 years ago
1.0.6
6 years ago
1.0.5
6 years ago
1.0.4
6 years ago
1.0.3
6 years ago
1.0.2
6 years ago
1.0.1
6 years ago