0.2.6 • Published 1 year ago
vue-line-chart v0.2.6
Vue3 Chart Line
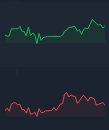
Custom Vue.js line chart is a customizable and interactive chart component built using Vue.js. It allows users to display data in a visually appealing way using lines to connect data points.
Features
- Easy to use
- svg support
- Vue3 support
- Animation
- Lightweight
Documentation

Install
npm i vue-line-chart
yarn i vue-line-chart
Usage
<script setup>
  import {chart} from "vue-line-chart"
  /// to styling
  import "vue-line-chart/style.css"
</script><chart/>props
| Prop Name | Description | Default | Type |
|---|---|---|---|
| points | List of dots that draw the chart | ... | Number |
| bgColor | Background color(just HEX) | "#e71f1f66" | String |
| lineColor | color of the line | "#e71f1f" | String |
| strokeWidth | stroke size of the line | 2 | Number |
| hasBg | Remove background color | true | Boolean |
Author
Amin Alinejad
License
Vue Line Chart is available under the MIT license.