2.3.0 • Published 3 years ago
vuecharts3 v2.3.0
vuecharts
简体中文 | English
design
- Baidu EFE team have one vue component wrapper for echarts which named vue-echarts
- this project write vue3 component wrapper echarts, API like BizCharts, using this project draw charts, not configure charts!
- typescript support
install
yarn add vuecharts3Components
| export components | |
|---|---|
| series | Line, Bar, Pie, Scatter, EffectScatter, Radar, Tree, Treemap, Sunburst, Boxplot, Candlestick, Heatmap, Map, Parallel, Lines, Graph, Sankey, Funnel, Gauge, PictorialBar, ThemeRiver, Custom |
| axis | XAxis, YAxis, Polar, RadiusAxis, AngleAxis, RadarAxis, ParallelCoordinates(parallel), ParallelAxis, SingleAxis, Calendar |
| dataZoom | DataZoom, Inside, Slider |
| visualMap | VisualMap, Continuous, Piecewise |
| graphic | Graphic, Group, Image, Text, Rect, Circle, Ring, Sector, Arc, Polygon, Polyline, GraphicLine(graphic.elements-line), BezierCurve |
| other | Title, Legend, Grid, Tooltip, AxisPointer, Toolbox, Brush, Geo, Timeline, Dataset, Aria |
DEMO
import 'echarts'
import Echarts from 'vuecharts3'

const { Chart, Title, Tooltip, Line, Bar, Legend, Grid, XAxis, YAxis } = Echarts

export default defineComponent({

  components: {
    Chart,
    Title, Tooltip, Bar, Line, Legend, Grid, XAxis, YAxis,
  },

  setup() {
    return {}
  }
})


// template

<template>
  <div class="container">
    <Chart>
      <Grid :top="100" />
      <Legend :data="['data1', 'data2']" :top="65" />
      <Title text="Top Title" subtext="sub title" left="center" :top="10" />
      <Title text="Bottom Title" top="bottom" left="center" />
      <Bar name="data1" :data="[0.32, 0.45, 0.2]" />
      <Bar name="data2" :data="[0.2, 0.5, 0.3]" />
      <Line name="data2" :data="[0.2, 0.5, 0.3]" />
      <YAxis />
      <XAxis :data="['x1', 'x2', 'x3']" />
      <Tooltip trigger="axis" />
    </Chart>
    <h2>Heatmap work with VisualMap</h2>
    <Chart>
      <Tooltip position="top" />
      <Grid top="10%" height="50%" />
      <XAxis :data="hours" />
      <YAxis :data="days" type="category" />
      <VisualMap :calculable="true" orient='horizontal' left='center' bottom="15%" :min="0" max="10" />
      <Heatmap name="Punch Card" :data="data" :label="{show: true}" :emphasis="{itemStyle: { shadowBlur: 10, shadowColor: 'rgba(0, 0, 0, 0.5)'}}" />
    </Chart>
  </div>
</template>
custom component
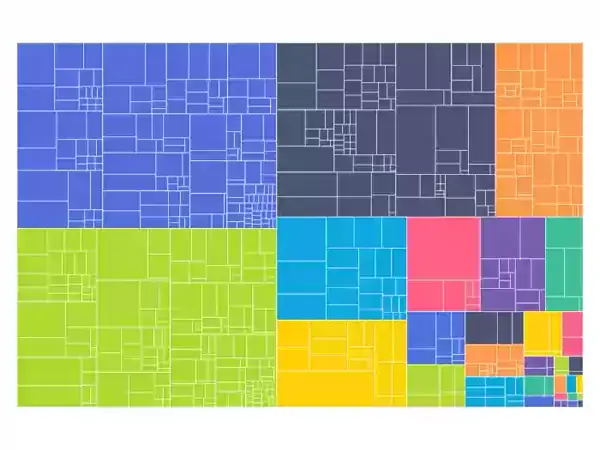
- echarts example by using vuecharts3
import { contextSymbol } from 'vuecharts3'

const TreemapSunburstTransition = defineComponent({
  name: 'TreemapSunburstTransition',
  inject: [contextSymbol],
  setup() {
    const { chart } = inject(contextSymbol)
    const interval = ref()
    const state = reactive({
      data: null,
      type: '',
    })

    const url = "https://fastly.jsdelivr.net/gh/apache/echarts-website@asf-site/examples/data/asset/data/echarts-package-size.json"
    fetch(url).then(res => res.json()).then(data => {
      state.data = data.children
      console.log('data.value', data.children)
      interval.value = setInterval(function () {
        state.type = state.type == 'treemap' ? 'sunburst' : 'treemap'
        console.log('state.type', state.type)
      }, 3000);
    })
    onUnmounted(() => clearInterval(interval.value))
    return () => state.type == 'treemap' ?
      h(Treemap, {
        id: 'echarts-package-size',
        animationDurationUpdate: 1000,
        roam: false,
        nodeClick: undefined,
        data: state.data,
        universalTransition: true,
        label: {
          show: true
        },
        breadcrumb: {
          show: false
        }
      }) : h(Sunburst, {
        id: 'echarts-package-size',
        radius: ['20%', '90%'],
        animationDurationUpdate: 1000,
        nodeClick: undefined,
        data: state.data,
        universalTransition: true,
        itemStyle: {
          borderWidth: 1,
          borderColor: 'rgba(255,255,255,.5)'
        },
        label: {
          show: false
        }
      })
  }
})

// template
<Chart>
  <TreemapSunburstTransition />
</Chart>
2.3.0
3 years ago
2.2.8
3 years ago
2.2.7
3 years ago
2.2.6
3 years ago
2.2.7-beta.0
3 years ago
2.2.6-beta.0
3 years ago
2.2.7-beta.1
3 years ago
2.2.5
3 years ago
2.2.4
3 years ago
2.2.3
3 years ago
2.2.2
3 years ago
2.2.1
3 years ago
2.2.0
3 years ago
2.1.0
3 years ago
2.0.3
3 years ago
2.0.2
3 years ago
2.0.1
3 years ago
2.0.0
3 years ago
1.0.5
3 years ago
1.0.4
3 years ago
1.0.3
3 years ago
1.0.2
3 years ago
1.0.1
3 years ago
1.0.0
3 years ago