
HealthcheckWrangler
Playwright-based site monitoring with Lighthouse audits, a built-in status dashboard, and persistent storage via TimescaleDB. Checks that key page elements are visible, measures Core Web Vitals, and stores everything in a queryable database with a real-time web UI.
Dashboard
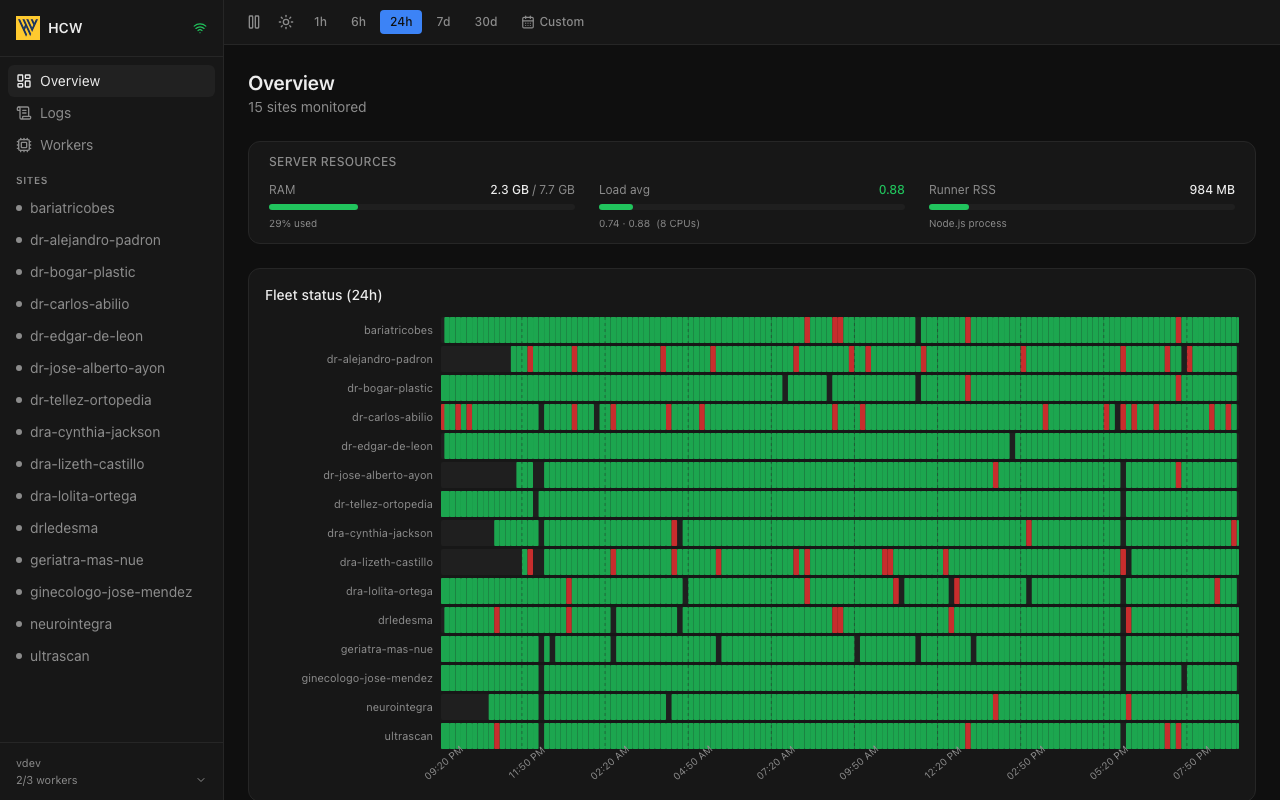
Fleet status timeline · server resource monitor · per-site uptime cards
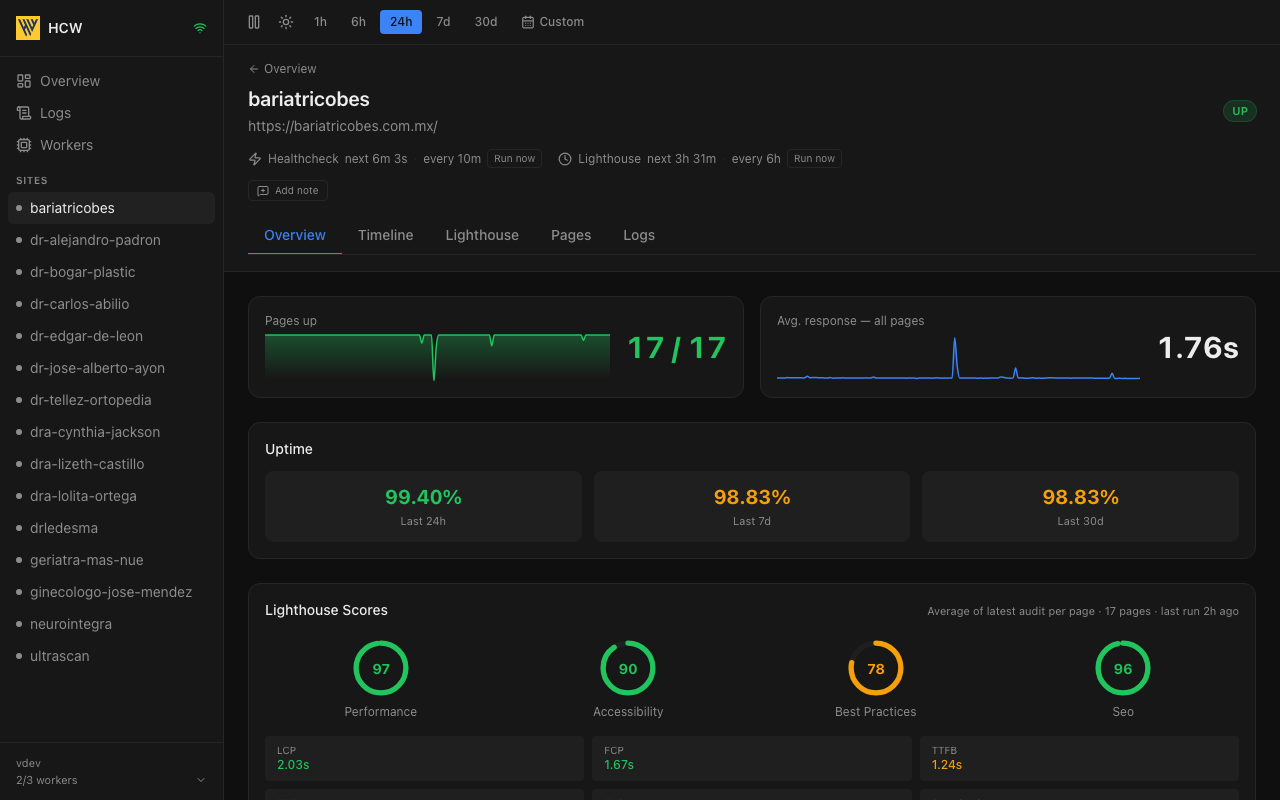
Site detail · 24h/7d/30d uptime % · availability sparklines · Lighthouse score averages and Core Web Vitals
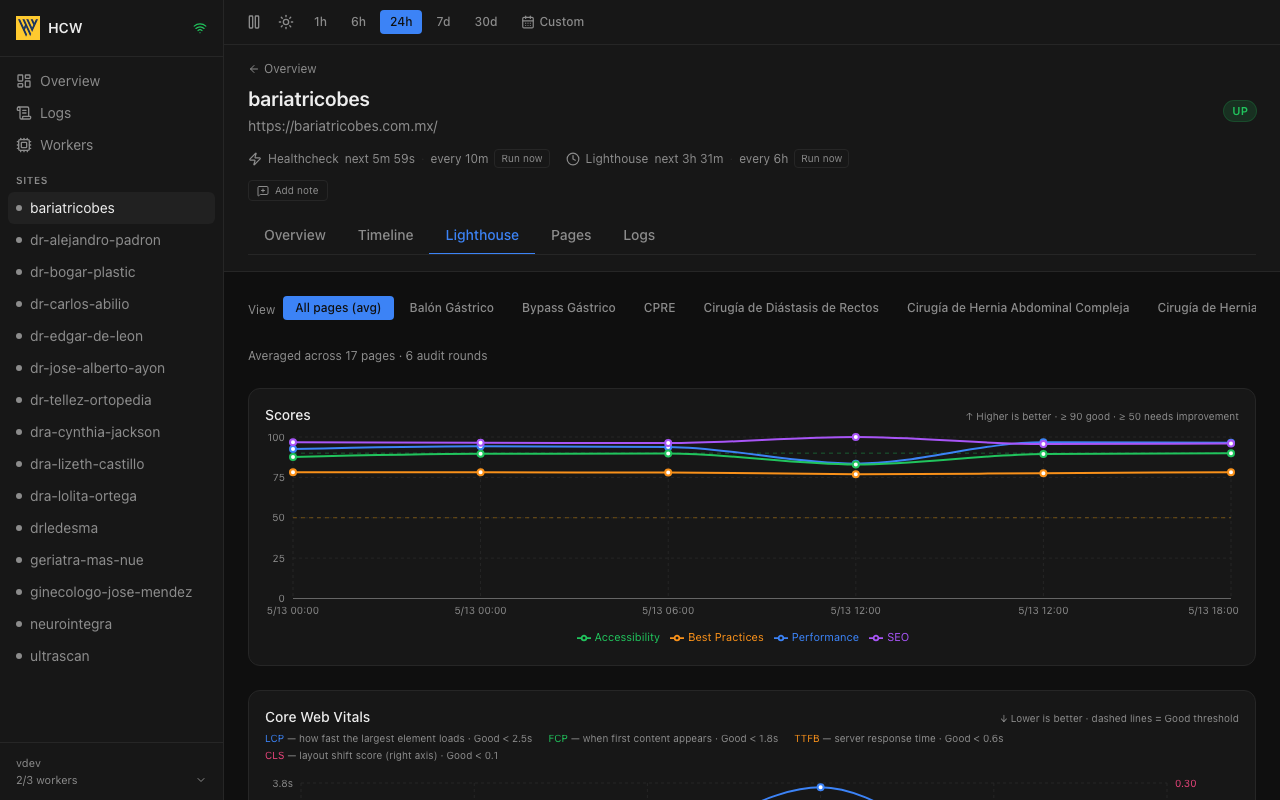 |
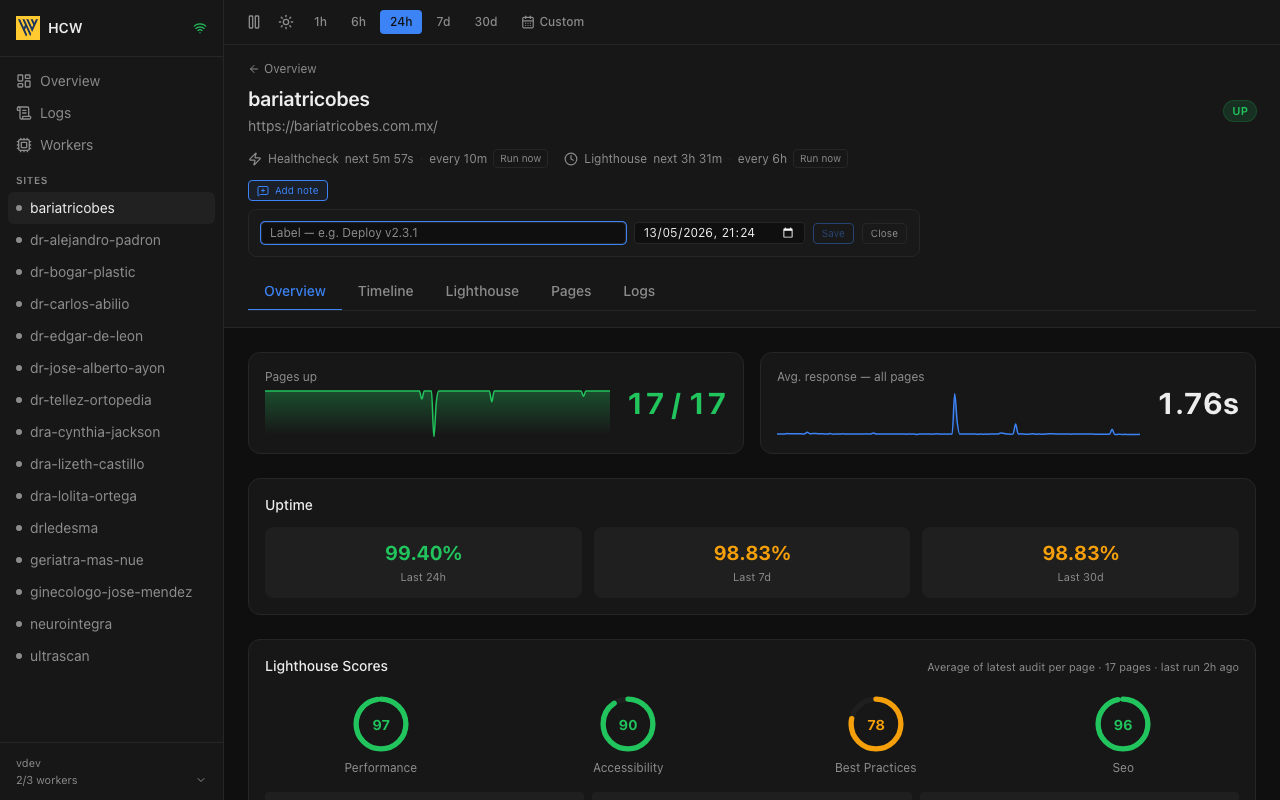 |
| Lighthouse score and Core Web Vitals history | Annotation panel — timestamped notes shown as markers on charts |
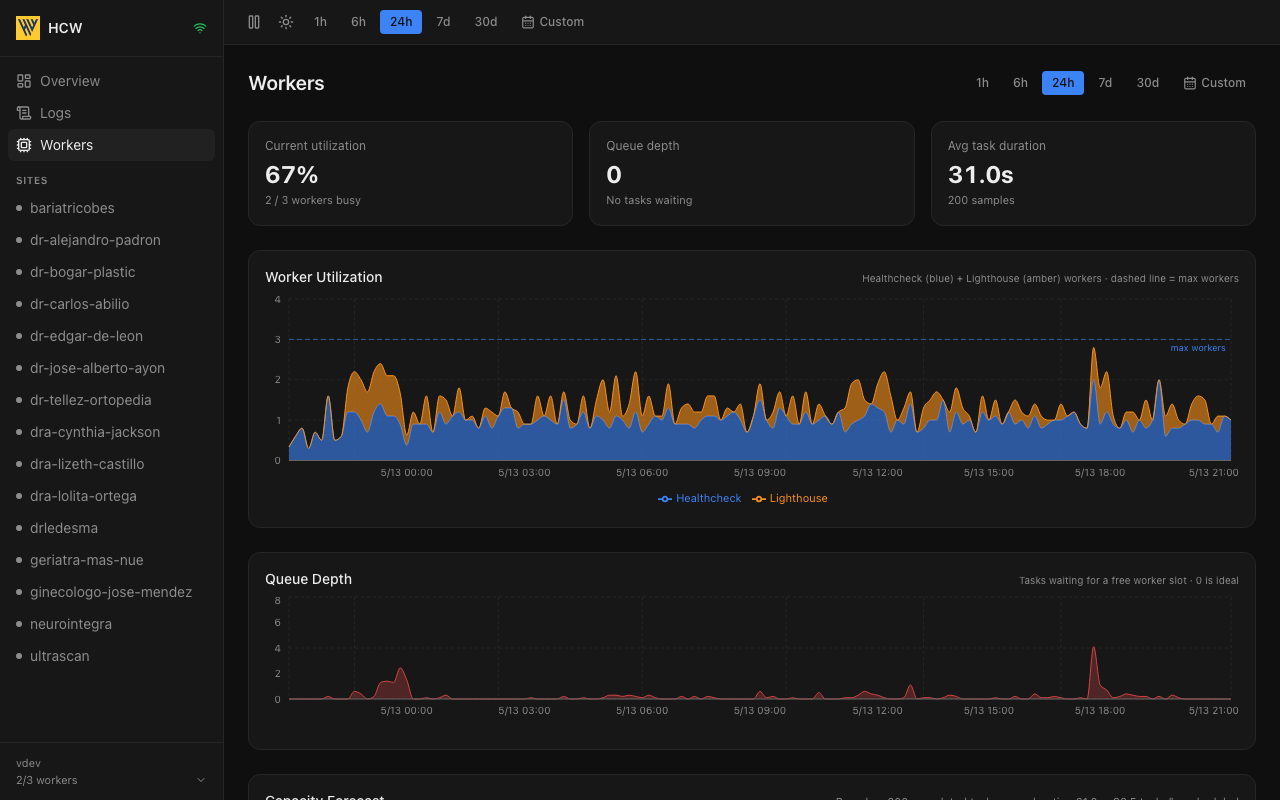
Worker monitoring · utilization history · queue depth · capacity forecast with +1/−1 worker scenarios
 |
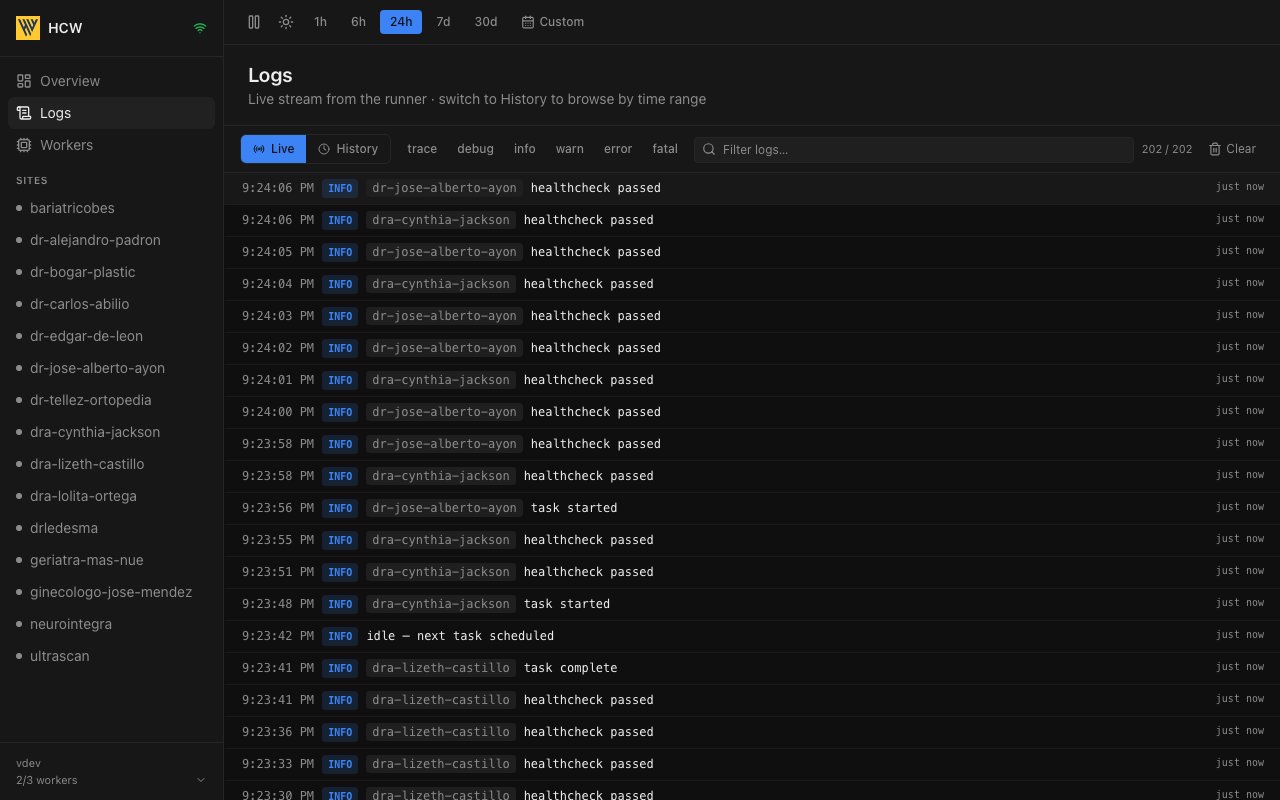 |
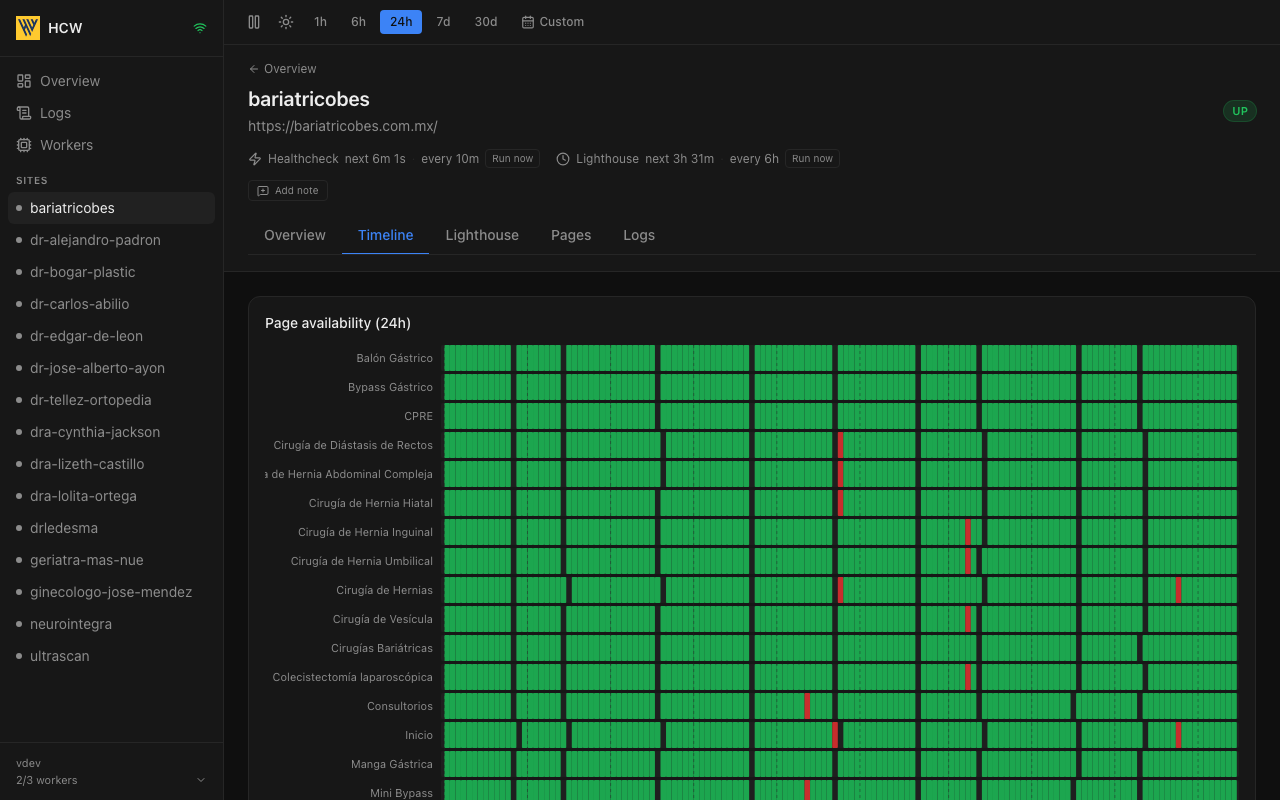
| Page availability timeline with annotation markers | Live log stream with level filter and full-text search |
How it works
The runner loads site configs from a sites/ directory. For each site it:
- Healthcheck — opens each page in headless Chromium and verifies that configured CSS selectors are visible. Results are stored in TimescaleDB and surfaced in the dashboard.
- Lighthouse audit — runs a full Lighthouse audit on each page and records performance, accessibility, best practices, SEO scores, and all Core Web Vitals.
A built-in React dashboard (:3001) shows real-time status, fleet timelines, per-site availability history, Lighthouse scores, and a structured log viewer. TimescaleDB stores 6 months of check results and 7 days of logs by default.
Default stack
docker compose up -dStarts three services:
- TimescaleDB — persistent storage (internal only, not exposed to host)
- runner — Playwright checks + Lighthouse audits + API server on
:8080 - dashboard — React UI on
:3001, proxies to runner API
Open http://localhost:3001 to see the dashboard.
Quick start
# 1. Clone the repo
git clone https://github.com/healthcheckwrangler/healthcheck-wrangler
cd healthcheck-wrangler

# 2. Copy and edit config
cp config.yaml.example config.yaml
cp .env.example .env
# Set DB_PASSWORD in .env

# 3. Add your first site
npm install
npx hcw add-site

# 4. Validate selectors before enabling monitoring
npx hcw check --site <your-site>

# 5. Start the stack
docker compose up -d
Site configuration
Each site is a YAML file in sites/. See sites/example.yaml for a fully annotated example.
name: my-site
baseUrl: https://example.com
enabled: true        # set false to disable all monitoring (site still appears in dashboard)
alerting: true       # true = use defaults | false = silent | {add:[...], remove:[...]} = override

# pageDelayMs: 2000  # wait 2s between page requests (for servers that can't handle rapid hits)

healthcheck:
  enabled: true
  intervalMinutes: 10

lighthouse:
  enabled: true
  intervalMinutes: 360
  throttling: mobile   # mobile | desktop

pages:
  - path: /
    name: Home
    selectors:
      - "nav"
      - "main"
      - "footer"
The runner hot-reloads site configs — no restart needed when you add or edit a YAML file.
CLI reference
Install the CLI locally:
npm install @healthcheckwrangler/hcwOr run directly in a project directory with npx hcw <command>.
hcw check
Dry-run healthchecks and print pass/fail for every selector.
hcw check [options]

Options:
  -s, --site <name>   site to check — skips interactive picker
  -p, --page <path>   only check this page path (e.g. /)
  --all               check all sites without prompting
  --headed            open a visible browser window
  --sites-dir <path>  override sites directory
hcw lighthouse
Run a Lighthouse audit and open the HTML report.
hcw lighthouse [options]

Options:
  -s, --site <name>     site to audit — skips interactive picker
  -p, --page <path>     page path to audit — skips interactive picker
  --no-open             do not open the HTML report after running
  --sites-dir <path>    override sites directory
  --reports-dir <path>  override reports directory
hcw add-site
Scaffold a new site YAML under the sites directory.
hcw add-site [name] [baseUrl] [options]

Options:
  --force              overwrite an existing file without prompting
  --sites-dir <path>   override sites directory
hcw scrape-nav
Scrape all same-origin navigation links from a CSS selector and output as JSON. Useful for discovering pages to monitor.
hcw scrape-nav [baseUrl] [navSelector] [options]

Options:
  --timeout <ms>   navigation timeout in milliseconds (default: 30000)
Configuration reference
See config.yaml.example for all options with inline documentation.
| Setting | Default | What it controls |
|---|---|---|
project.name |
healthcheck-wrangler |
Label used in User-Agent string and logs |
runner.workers |
3 |
Max concurrent healthcheck tasks |
runner.lighthouseWorkers |
1 |
Max concurrent Lighthouse audits (keep at 1 — parallel audits distort scores) |
runner.workerMonitoring |
true |
Record worker utilization history for the /workers dashboard |
runner.pageDelayMs |
0 |
Milliseconds to wait between page requests within a site (overridable per site) |
runner.apiPort |
8080 |
Dashboard API port (set to 0 to disable) |
runner.logRetentionDays |
7 |
How long logs are kept in TimescaleDB |
runner.resultsRetentionDays |
180 |
How long check and Lighthouse results are kept |
runner.lighthouseReportRetentionDays |
7 |
How long HTML/JSON Lighthouse report files are kept on disk |
healthcheck.defaultIntervalMinutes |
10 |
Check interval (overridable per site) |
healthcheck.defaultTimeoutSeconds |
30 |
Page navigation timeout |
lighthouse.defaultIntervalMinutes |
360 |
Audit interval (overridable per site) |
lighthouse.defaultThrottling |
mobile |
mobile (slow 3G simulation) or desktop |
Database connection is read from the DATABASE_URL environment variable. If not set, the runner operates without persistence (in-memory only, no dashboard data).
Alerting
Built-in channel-based alerting fires on state transitions only — once when a site goes down, once when it recovers. No repeated notifications while a site stays down.
Defining channels
Each channel is defined once in config.yaml with a unique name. The defaults.channels list controls which channels apply to all sites by default:
alerting:
  defaults:
    channels: [ops-chat]   # applied to every site unless overridden

  channels:
    - type: google-chat
      name: ops-chat
      webhookUrl: "https://chat.googleapis.com/v1/spaces/..."
      on:
        - site-down
        - site-recovery
        - high-memory      # host RAM > 85%
        - memory-recovered
        - high-load        # load avg > 90% of CPU core count
        - load-recovered

    - type: google-chat
      name: critical-only
      webhookUrl: "https://chat.googleapis.com/..."
      on: [site-down]
If defaults.channels is omitted, all defined channels apply to all sites.
Per-site overrides
Site YAMLs can adjust which channels they use without touching the global config:
alerting: true              # use defaults (inherited by all sites, no override needed)
alerting: false             # silence all alerts for this site
alerting:
  add: [critical-only]      # add a channel not in the default list
alerting:
  remove: [ops-chat]        # suppress a channel for this site
alerting:
  add: [critical-only]
  remove: [ops-chat]        # swap channels entirely
Event types
| Event | Trigger |
|---|---|
site-down |
All pages were up; at least one is now down |
site-recovery |
At least one page was down; all are up again |
high-memory |
Host RAM crosses 85% |
memory-recovered |
Host RAM drops below 70% |
high-load |
1-minute load avg crosses 90% of CPU core count |
load-recovered |
Load drops below 60% of CPU core count |
Resource metrics are sampled every 60 seconds regardless of dashboard usage.
Annotations
Annotations are timestamped notes that appear as vertical markers on time-series charts — useful for correlating deployments or config changes with performance trends.
Creating annotations from the dashboard
Open any site's detail page, click Add note in the header, type a label, and optionally adjust the timestamp (defaults to now). The note appears immediately on the Timeline and Lighthouse charts for that site.
Notes can be edited or deleted from the same panel.
Creating annotations from CI/CD
The runner API accepts annotation POSTs, making it easy to mark deployments automatically:
curl -X POST http://runner:8080/api/annotations \
  -H "Content-Type: application/json" \
  -d '{"label": "Deploy v2.3.1", "site": "my-site"}'
Omit site to create a fleet-wide annotation visible on all charts. Pass ts (Unix milliseconds) to backdate an annotation:
curl -X POST http://runner:8080/api/annotations \
  -H "Content-Type: application/json" \
  -d '{"label": "Config rollback", "site": "my-site", "ts": 1715000000000}'
Update or delete existing annotations:
# Update
curl -X PUT http://runner:8080/api/annotations/42 \
  -H "Content-Type: application/json" \
  -d '{"label": "Deploy v2.3.2 (hotfix)"}'

# Delete
curl -X DELETE http://runner:8080/api/annotations/42
Where annotations appear
- Timeline tab — vertical dashed line spanning all page rows, with a diamond marker and label
- Lighthouse tab — vertical dashed line on the Scores and Core Web Vitals charts
- Overview tab — vertical marker on the Pages up sparkline
Annotations are filtered to the chart's visible time range client-side, so switching to a wider range (e.g. 7d) reveals older markers automatically.
Worker monitoring
The /workers dashboard page tracks how busy workers are over time and projects capacity requirements.
What it shows
- Utilization chart — stacked area of active healthcheck + Lighthouse workers vs the configured max, sampled once per minute
- Queue depth — tasks that were due but had to wait for a free worker slot
- Capacity forecast — comparison table for N−1, current, and N+1 worker scenarios: throughput (tasks/hr), saturation %, average queue wait time, and estimated RAM impact
- Recommendations — rule-based suggestions: whether to add a worker, reduce check intervals, or scale down
Interpreting the forecast
Saturation is the ratio of scheduled task-hours to available worker-hours per hour. At 100% saturation, every scheduled task runs back-to-back with no idle time — tasks start queuing above this point.
The RAM estimates are approximate: healthcheck workers are concurrent async tasks within a single Node.js process, not separate processes, so memory cannot be cleanly attributed per worker. Treat the figures as order-of-magnitude guidance.
os.totalmem() reflects the container's memory limit on Docker with cgroup v2 (Docker ≥ 20.10). On older setups it may return host RAM instead.
Configuration
runner:
  workers: 3              # max concurrent tasks (healthcheck + lighthouse combined)
  lighthouseWorkers: 1    # max concurrent Lighthouse audits (keep at 1 for accurate scores)
  workerMonitoring: true  # set false to disable history recording (~1 DB write/minute)
Worker stats are retained for the same period as check results (runner.resultsRetentionDays, default 180 days).
Instance pattern
For production use, create a separate repository that mounts your sites/ and config.yaml into the published Docker image:
# docker-compose.yml in your instance repo
services:
  timescaledb:
    image: timescale/timescaledb:latest-pg17
    environment:
      POSTGRES_DB: hcw
      POSTGRES_USER: hcw
      POSTGRES_PASSWORD: ${DB_PASSWORD}
    volumes:
      - timescaledb-data:/var/lib/postgresql/data
    healthcheck:
      test: ["CMD-SHELL", "pg_isready -U hcw"]
      interval: 10s
      retries: 5

  runner:
    image: ghcr.io/healthcheckwrangler/healthcheck-wrangler:latest
    environment:
      DATABASE_URL: postgresql://hcw:${DB_PASSWORD}@timescaledb:5432/hcw
    volumes:
      - ./sites:/app/sites:ro
      - ./reports:/app/reports
      - ./config.yaml:/app/config.yaml:ro
    depends_on:
      timescaledb:
        condition: service_healthy

  dashboard:
    image: ghcr.io/healthcheckwrangler/healthcheck-wrangler:latest
    command: ["node", "--enable-source-maps", "dist/src/dashboard/server.js"]
    environment:
      RUNNER_API_URL: http://runner:8080
      DASHBOARD_PORT: "3001"
    ports:
      - "3001:3001"
    depends_on:
      - runner

volumes:
  timescaledb-data:
This keeps your site configs versioned separately from the engine. Pull engine updates with:
docker compose pull && docker compose up -d