
JavaScript HeatMap Control
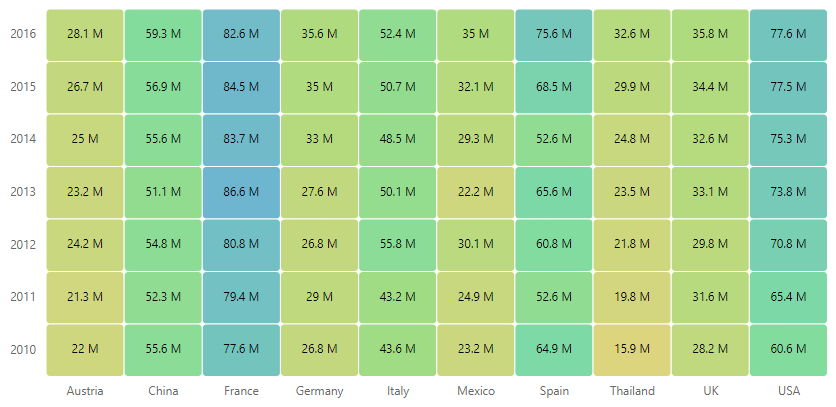
The JavaScript HeatMap control is a graphical representation of two-dimensional data where the values are represented with gradient or solid color variations. The data points are rendered as HeatMap cells using Scalable Vector Graphics (SVG) or canvas UI rendering.
Getting started . Online demos . Learn more
Trusted by the world's leading companies

Using this package with an AI coding agent
Before generating Syncfusion code, ask your AI coding agent to run the Syncfusion setup using the following prompt:
Set up this project for Syncfusion before generating code. Fetch
and follow the official instructions at https://ai.syncfusion.com,
then report the detected platform, installed skill pack, MCP
status, and any required licensing action.
The setup detects your project’s platform and loads the appropriate Syncfusion skill pack. No Syncfusion account or MCP key is required to install or read Syncfusion agent skills.
Platform reference: https://ai.syncfusion.com/javascript/llms.txt
Setup
To install the HeatMap and its dependent packages, use the following command.
npm install @syncfusion/ej2-heatmapSupported frameworks
HeatMap control is also offered in the following list of frameworks.
 Angular |
 React |
 Vue |
 ASP.NET Core |
 ASP.NET MVC |
|---|
Showcase samples
- Annual Flight Traffic Report - Live Demo
- Expense Tracker - Source, Live Demo
- Loan Calculator - Source, Live Demo
Key features
- Data binding: Binding data in JSON and two-dimensional array formats is supported.
- Axis types: Supports three different types of axes to populate the data, namely Numerical, Categorical and DateTime.
- Axis: Supports inverted axis, opposed position and axis intervals.
- Rendering modes: Supports automatic switching between SVG and Canvas rendering modes based on the data source length.
- Palette: Different colors are provided for different value ranges to be used in the cells.
- Legend: Summarizes the information for the colors which represents each values in HeatMap.
- Tooltip: Provides information about the cell values on hover.
- Selection: Supports selecting the cells that will be the center of attraction.
- Templates: Templates can be used to create custom user experience in the tooltip of the heatmap.
Resources
Support
Product support is available through the following mediums.
- Support ticket - Guaranteed Response in 24 hours | Unlimited tickets | Holiday support
- Community forum
- GitHub issues
- Request feature or report bug
- Live chat
Changelog
Check the changelog here. Get minor improvements and bug fixes every week to stay up to date with frequent updates.
License and copyright
This is a commercial product and requires a paid license for possession or use. Syncfusion’s licensed software, including this control, is subject to the terms and conditions of Syncfusion's EULA. To acquire a license for 140+ JavaScript UI controls, you can purchase or start a free 30-day trial.
A free community license is also available for companies and individuals whose organizations have less than $1 million USD in annual gross revenue and five or fewer developers.
See LICENSE FILE for more info.
Copyright 2026 Syncfusion Inc. All Rights Reserved. The Syncfusion Essential Studio license and copyright applies to this distribution.