Telemetry Tracker
![]()


Open-source error tracking, product analytics, and session telemetry.
Lightweight and self-hosted for your own infrastructure—or use the official hosted cloud at telemetry-tracker.com with Stripe billing (EUR).
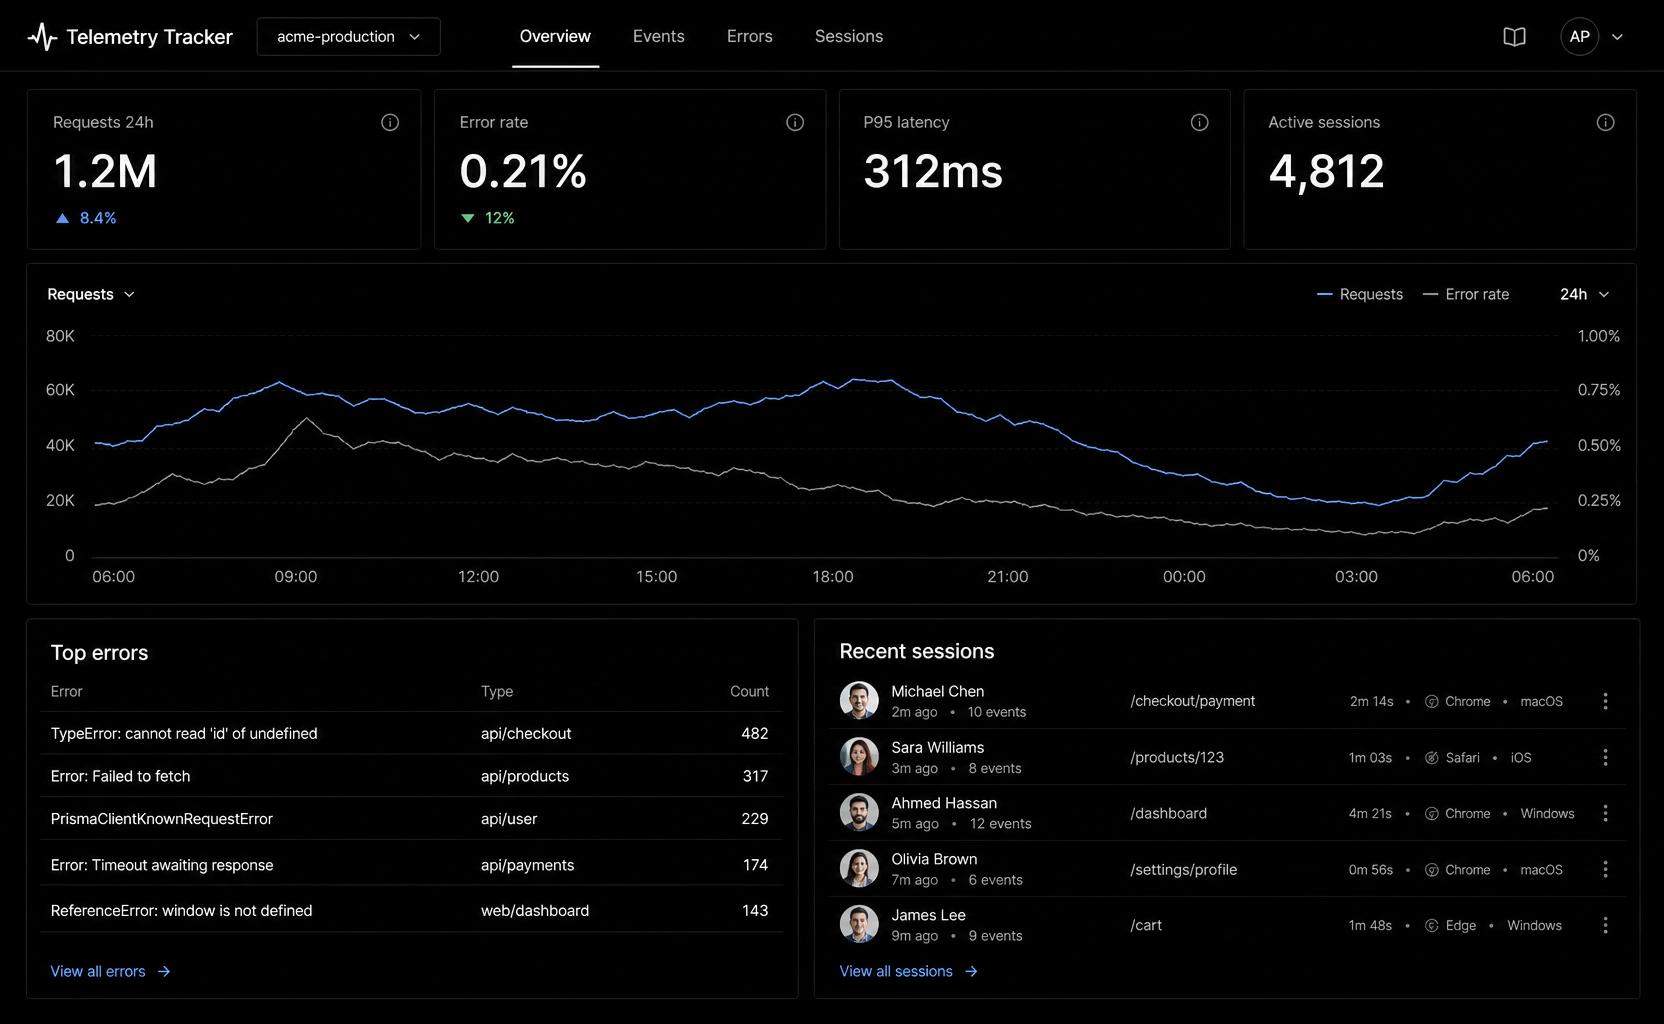
Overview — trend charts, top errors, and recent sessions filtered by app and time range.
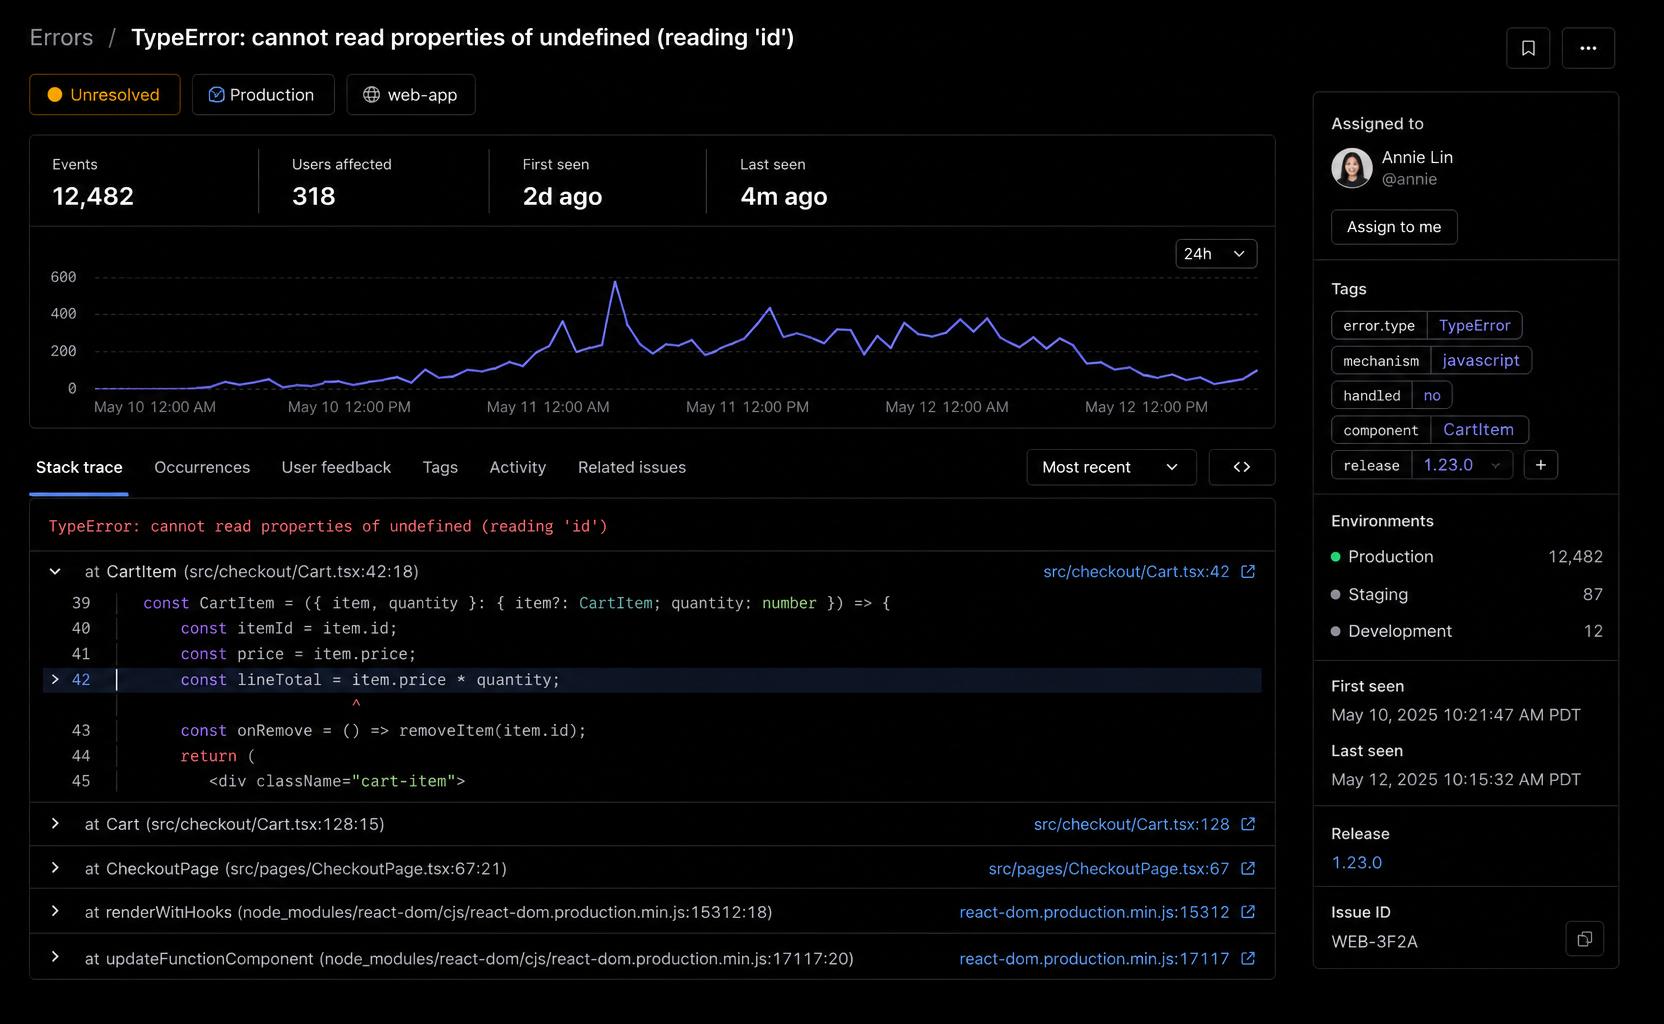
Error detail — grouped exceptions with stack traces, occurrence context, and release tags.
Features
| Feature | Supported |
|---|---|
| Errors | |
| Events | |
| Sessions | |
| Organizations | |
| Projects | |
| API keys | |
| Dashboard | |
| REST API | |
SDKs (@telemetry-tracker/*) |
|
| Self-hosted | |
| Hosted cloud (telemetry-tracker.com) | |
| Paid plans (Free / Pro / Business, EUR via Stripe) | |
| Alerting | |
| Source maps |
Self-host setup: DEPLOYMENT.md
Why Telemetry Tracker?
Telemetry Tracker provides the core building blocks most applications need—error tracking, product analytics events and session telemetry—without the complexity of enterprise observability platforms.
- Self-hosted for your own products
- Official hosted cloud with EUR billing
- Lightweight
- Simple APIs
- Open source (MIT)
- Easy to deploy (DEPLOYMENT.md)
Architecture
Client SDK
    ↓  ingest (API key)
   API  ←──  Dashboard (session auth)
    ↓
 PostgreSQL
Apps send errors, events, and sessions to the API via @telemetry-tracker/*. The dashboard reads telemetry through the same API—never directly from the database.
Quick Start
Get Telemetry Tracker running locally in under 5 minutes.
Prerequisites: Node.js 18+, pnpm 9, PostgreSQL 16 (Docker works).
git clone https://github.com/Telemetry-Tracker/telemetry-tracker.git
cd telemetry-tracker
pnpm install
docker compose up -d
cp apps/api/.env.example apps/api/.env
cp apps/dashboard/.env.example apps/dashboard/.env
pnpm db:migrate
In two terminals:
pnpm dev:api        # API → http://localhost:3001
pnpm dev:dashboard  # Dashboard → http://localhost:3000
Then:
- Open http://localhost:3000, click Start tracking, and create an account.
- Create an organization and project in Organization settings.
- Create an API key under Settings → API keys (copy the
tt_live_…secret once). - Instrument your app (see SDK example below) and check Overview in the dashboard.
SDK
Works with:
- ✓ React —
@telemetry-tracker/core - ✓ Next.js —
@telemetry-tracker/next - ✓ Node —
@telemetry-tracker/node - ✓ React Native —
@telemetry-tracker/react-native - ✓ Vanilla JS —
@telemetry-tracker/core
Guides: core · Next.js · Node · React Native
Example
Install from npm:
pnpm add @telemetry-tracker/coreimport { init, trackEvent, trackError } from "@telemetry-tracker/core";
init({
ingestUrl: "http://localhost:3001",
app: "my-app",
apiKey: process.env.TELEMETRY_API_KEY!, // tt_live_… from dashboard
environment: "development",
});
trackEvent("user_registered");
trackError(new Error("Something broke"));Project Structure
apps/
  api/          # Fastify ingest + read API, Prisma, auth, billing
  dashboard/    # Next.js UI

packages/
  telemetry-core/
  telemetry-node/
  telemetry-next/
  telemetry-react-native/
Built With
- Next.js — dashboard
- Fastify — API
- Prisma — ORM & migrations
- PostgreSQL — database
- TypeScript
- pnpm — monorepo
- Docker — local development (Postgres via
docker compose; dashboard production image)
Roadmap
- Errors
- Events
- Sessions
- Dashboard
- Alerting
- Source maps
- Performance monitoring
- Multi-project dashboards
- Team audit logs
- Hosted cloud (telemetry-tracker.com)
- Paid plans (Stripe, EUR)
Contributing
Contributions are welcome! Read CONTRIBUTING.md for local setup and what CI runs.
Good places to start:
- Good first issues
- help wanted issues
Please follow the Code of Conduct. Report security issues privately via SECURITY.md—not public issues.
Documentation
| Topic | Doc |
|---|---|
| Architecture overview | docs/ARCHITECTURE.md |
| Deploy (overview) | DEPLOYMENT.md |
| Railway setup & troubleshooting | docs/RAILWAY.md |
| Stripe & Resend (optional) | docs/BILLING.md |
| Production checklist | docs/PRODUCTION-READINESS.md |
| Releases & deploy runbook | docs/RELEASE.md |
| Changelog | CHANGELOG.md |
| RBAC & org model | docs/RBAC.md |
| Plans & ingest auth | docs/ENTITLEMENTS.md |
| SDK guides | docs/sdk-core.md, docs/sdk-next.md, docs/sdk-node.md, docs/sdk-react-native.md |
| Source maps | docs/source-maps.md |
Publish SDK packages: npm login → pnpm publish:packages (see CONTRIBUTING.md and root package.json scripts).
GitHub social preview: In repo Settings → General → Social preview, use https://telemetry-tracker.com/opengraph-image (1200×630) once the dashboard is deployed. Install path for docs and marketing: @telemetry-tracker/core (see npm badges above).
Support the Project
If you find Telemetry Tracker useful:
- Star this repository
- Report bugs
- Suggest features
- Open a pull request
License, trademark & hosting
Software (MIT)
This project’s source code is licensed under the MIT License. You may use, modify, self-host, and distribute the software under those terms, including the copyright notice in copies you distribute.
MIT covers copyright on the code. It does not grant rights to use the Telemetry Tracker name or branding in ways that suggest Tacko operates or endorses your service. See TRADEMARK.md.
Self-hosting
You may run Telemetry Tracker on infrastructure you control for your own applications — no separate permission required under MIT.
Official hosted cloud
The managed service at telemetry-tracker.com is operated by Tacko. Pro and Business plans there are billed in EUR via Stripe.
Brand & competing hosted services
Do not offer a multi-tenant hosted service to third parties using the Telemetry Tracker name, logo, or marketing as if it were the official product. Forks and internal deployments should use a distinct name unless you have written permission from Tacko.
Details and examples: TRADEMARK.md · Partnerships: info@tacko.io