@tehsurfer/plotvuerwidget v0.2.27
plotvuer
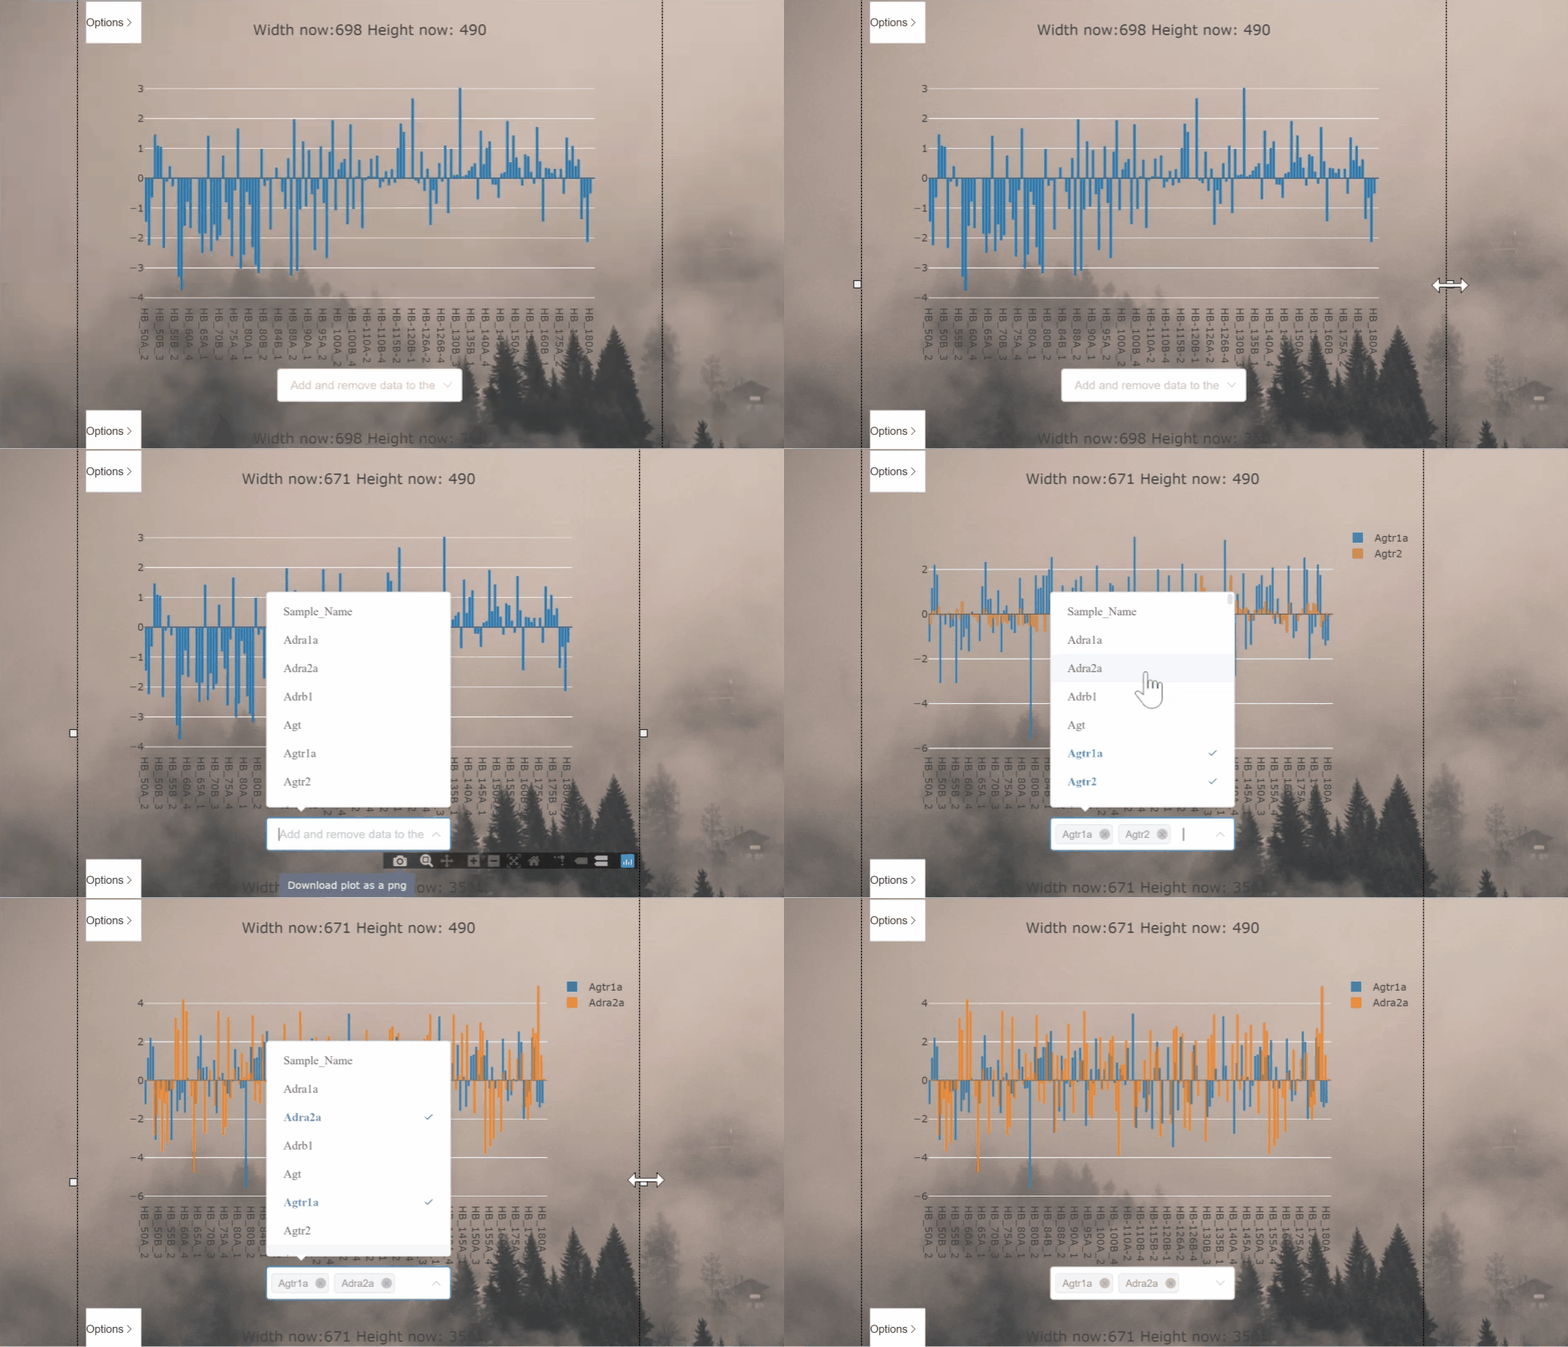
This project aims to process and display csv files as graphs in the vue framework
Demo the site functionality of this app here*.
*Demo will take 30s to load while Heroku server boots

Project installation
npm i @abi-software/plotvuerProject setup
npm install
npm run serve
Compiles and minifies for production
npm run build-bundleHow to use
Include the package in your script.
import '@abi-software/plotvuer'
import '@abi-software/plotvuer/dist/plotvuer.css'
The snippet above registers the Plotvuer component into the global scope. You can now use the Plotvuer in your vue template as followed:
<PlotVuer :url="csvfile.csv"></PlotVuer>Optional Parameters: 1. Type of plot - Use 'scatter, 'heatmap', or 'barplot'. 2. Plot filters - Filters will preload the plot with the supplied data
<PlotVuer :url="csvfile.csv" :plotType="'scatter'" :xAxisFilter="['step1', 'step2']"></PlotVuer>url should be the variable/string containing the url of a csv file.
plotType is the type of plot we wish to see the data as one of: 'heatmap', 'scatter', 'barplot'
xAxisFilter and yAxisFilter provide filters to load the plot with selected filters displayed.
CSV file formatting
plotvuer will load and csv file that follow the form of headers on first row and coloumn and if data is time based, rows will be assumed to be time dependant.
Example 1. Heatmap data
| Gene 1 | Gene 2 | |
|---|---|---|
| Sample 1 | -1.54 | -3.40 |
| Sample 2 | 0.68 | 1.22 |
| Sample 3 | 0.05 | 0.66 |
Example 2. Timeseries data
| time (seconds) | Sweep 0_Membrane Potential (mV) |
|---|---|
| 0 | -70.12939453 |
| 0.0002 | -70.12939453 |
| 0.0004 | -70.34301758 |
5 years ago