chartjs-chart-geo v4.3.4
Chart.js Graphs
Chart.js module for charting maps with legends. Adding new chart types: choropleth and bubbleMap.
Works only with Chart.js >= 2.8.0


works great with https://github.com/chartjs/chartjs-plugin-datalabels
Install
npm install --save chart.js chartjs-chart-geoUsage
see Samples on Github
CodePens
Options
The option can be set globally or per dataset
interface IGeoChartOptions {
  /**
   * Outline used to scale and centralize the projection in the chart area.
   * By default a sphere is used
   * @default { type: 'Sphere" }
   */
  outline: Feature | Feature[];
  /**
   * option to render the outline in the background, see also the outline... styling option
   * @default false
   */
  showOutline: boolean;

  /**
   * option to render a graticule in the background, see also the outline... styling option
   * @default false
   */
  showGraticule: boolean | {
    stepMajor: [number, number],
    stepMinor: [number, number]
  };

  /**
   * option whether to clip the rendering to the chartArea of the graph
   * @default choropleth: true bubbleMap: 'outline+graticule'
   */
  clipMap: boolean | 'outline' | 'graticule' | 'outline+graticule' | 'items';
}
Choropleth
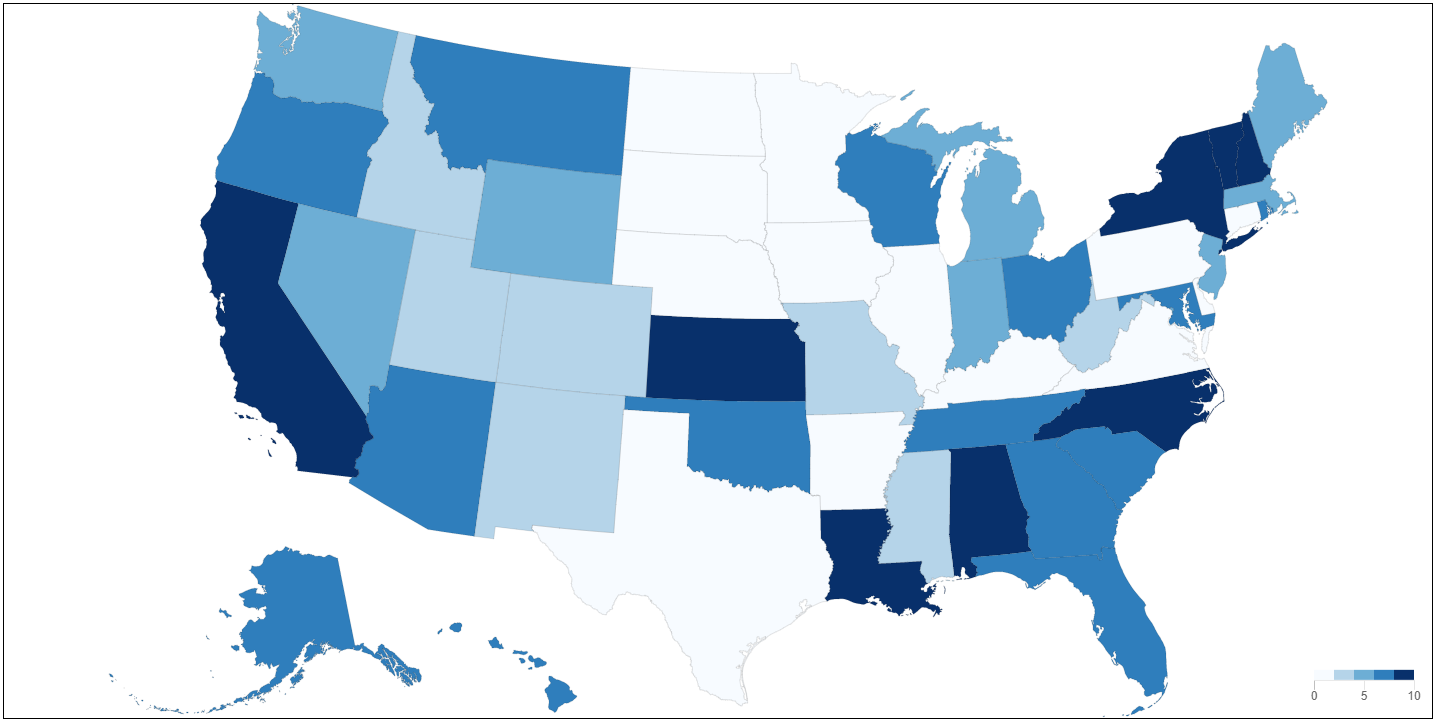
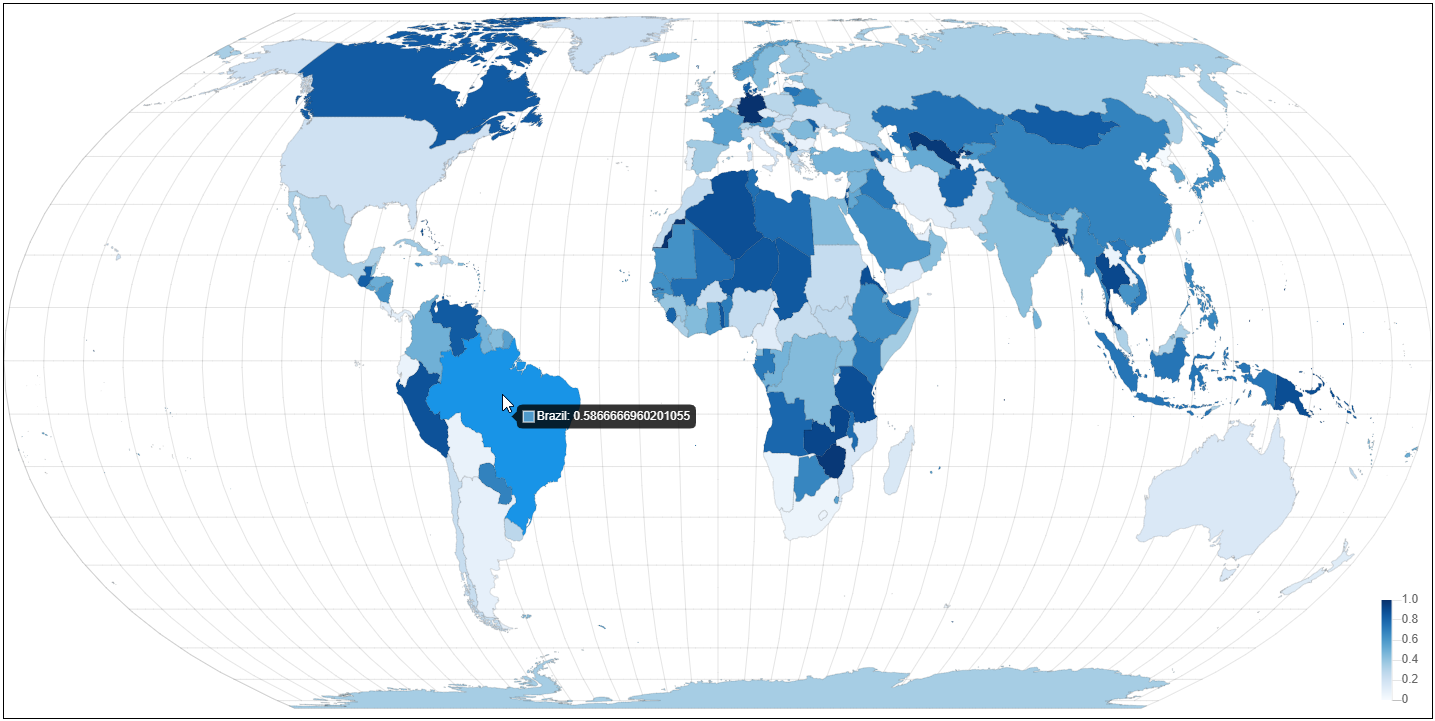
A Choropleth (chart type: choropleth) is used to render maps with the area filled according to some numerical value.


Data Structure
A data point has to have a .feature property containing the feature to render and a .value property containing the value for the coloring.
TopoJson is packaged with this plugin to convert data, it is exposed as ChartGeo.topojson in the global context.
const us = await fetch('https://unpkg.com/us-atlas/states-10m.json').then((r) => r.json());

// whole US for the outline
const nation = ChartGeo.topojson.feature(us, us.objects.nation).features[0];
// individual states
const states = ChartGeo.topojson.feature(us, us.objects.states).features;

const alaska = states.find((d) => d.properties.name === 'Alaska');
const california = states.find((d) => d.properties.name === 'California');
...

const config = {
  data: {
    labels: ['Alaska', 'California'],
    datasets: [{
      label: 'States',
      outline: nation, // ... outline to compute bounds
      showOutline: true,
      data: [
        {
          value: 0.4,
          feature: alaska // ... the feature to render
        },
        {
          value: 0.3,
          feature: california
        }
      ]
    }]
  },
  options: {
    // ! Only one scale is supported via the options.scale option
    scale: {
      projection: 'albersUsa' // ... projection method
    },
    geo: {
      colorScale: {
        display: true
      }
    }
  }
};
Styling
The styling of the new element GeoFeature is based on Rectangle Element with some additional options for the outline and graticule.
interface IGeoFeatureOptions {
  // all options of an Rectangle

  /**
   * background color for the outline
   * @default null
   */
  outlineBackgroundColor: string | null;
  /**
   * border color for the outline
   * @default defaultColor of Chart.js
   */
  outlineBorderColor: string;
  /**
   * border width for the outline
   * @default 0
   */
  outlineBorderWidth: number;

  /**
   * border color for the graticule
   * @default #CCCCCC
   */
  graticuleBorderColor: string;
  /**
   * border width for the graticule
   * @default 0
   */
  graticuleBorderWidth: string;
}
Legend and Color Scale
The coloring of the nodes will be done with a special color scale. The scale itself is based on a linear scale.
interface IGeoChartOptions {
  // can just be specified as a global option
  colorScale: IColorScaleOptions;
}

interface IColorScaleOptions {
  // support all options from linear scale -> https://www.chartjs.org/docs/latest/axes/cartesian/linear.html#linear-cartesian-axis
  // e.g. for tick manipulation, ...

  /**
   * whether to render a color legend
   * @default false (for compatibility reasons)
   */
  display: boolean;

  /**
   * color interpolation method which is either a function
   * converting a normalized value to string or a
   * well defined string of all the interpolation scales
   * from https://github.com/d3/d3-scale-chromatic.
   * e.g. interpolateBlues -> blues
   *
   * @default blues
   */
  interpolate: string | (normalizedValue: number) => string;

  /**
   * color value to render for missing values
   * @default transparent
   */
  missing: string;

  /**
   * allows to split the colorscale in N quantized equal bins.
   * @default 0
   */
  quantize: number;

  /**
   * orientation of the scale, e.g., `right` means that it is a vertical scale
   * with the ticks on the right side
   * @default right
   */
  position: 'left' | 'right' | 'top' | 'bottom';

  /**
   * the property name that stores the value in the data elements
   * @default value
   */
  property: string;

  legend: {
    /**
     * location of the legend on the chart area
     * @default bottom-right
     */
    position: 'left' | 'right' | 'top' | 'bottom' | 'top-left' | 'top-right' | 'top-right' | 'bottom-right';
    /**
     * length of the legend, i.e., for a horizontal scale the width
     * if a value < 1 is given, is it assume to be a ratio of the corresponding
     * chart area
     * @default 100
     */
    length: number;
    /**
     * how wide the scale is, i.e., for a horizontal scale the height
     * if a value < 1 is given, is it assume to be a ratio of the corresponding
     * chart area
     * @default 50
     */
    width: number;
    /**
     * how many pixels should be used for the color bar
     * @default 10
     */
    indicatorWidth: number;
    /**
     * margin pixels such that it doesn't stick to the edge of the chart
     * @default 8
     */
    margin: number;
  }
}
Bubble Map
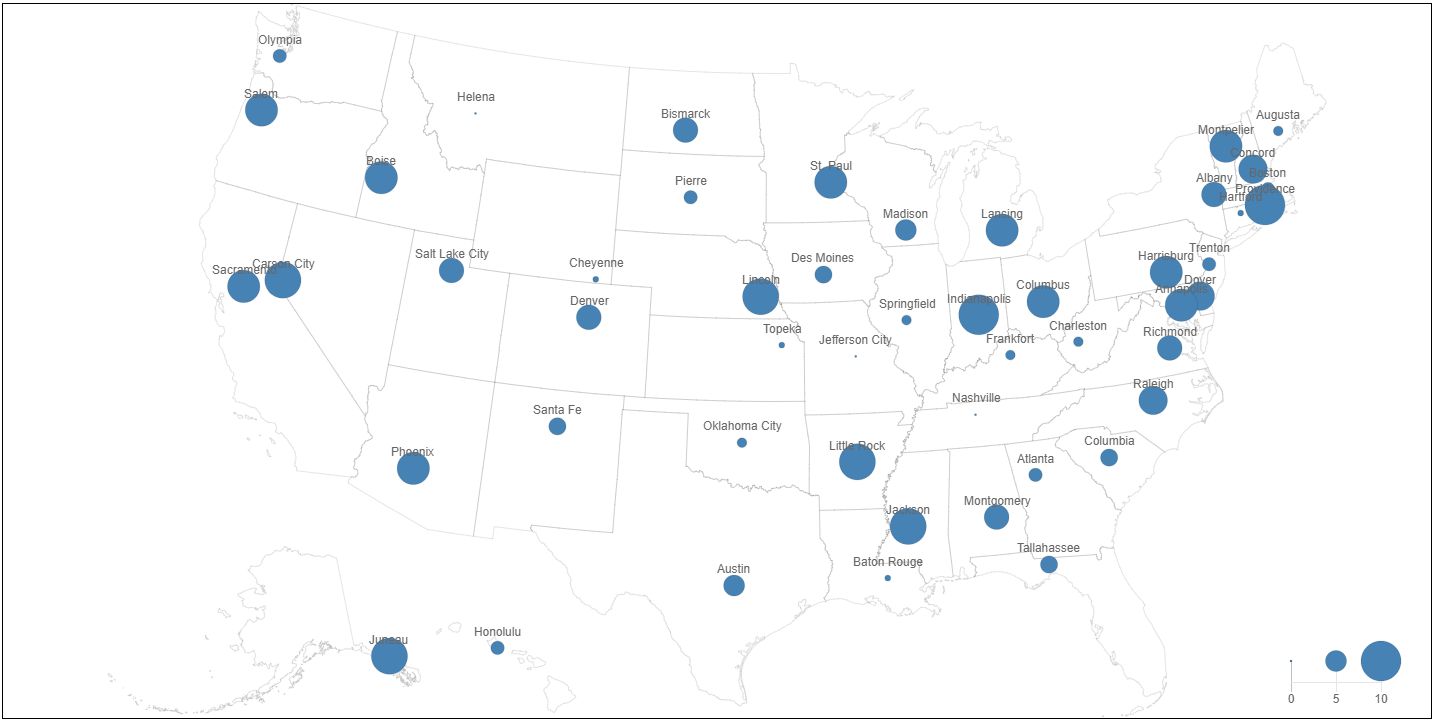
A Bubble Map (chart type: bubbleMap) aka Proportional Symbol is used to render maps with dots that are scaled according to some numerical value. It is based on a regular bubble chart where the positioning is done using latitude and longtitude with an additional radiusScale to create a legend for the different radi.

Data Structure
see Bubble Chart. Alternatively to x and y, the following structure can be used:
interface IBubbleMapPoint {
  longitude: number;
  latitude: number;
  value: number;
}Note: instead of using the r attribute as in a regular bubble chart, the value attribute is used, which is picked up by the radiusScale to convert it to an actual pixel radius value.
Styling
A regular point is used and thus supports the Point Element styling options. In addition, the outline* and graticule* are supported.
Legend
Similiar to the choropleth chart a new radiusScale is used to map the values to symbol radius size. The scale itself is based on a linear scale.
interface IGeoChartOptions {
  // can just be specified as a global option
  radiusScale: ISizeScaleOptions;
}

interface ISizeScaleOptions {
  // support all options from linear scale -> https://www.chartjs.org/docs/latest/axes/cartesian/linear.html#linear-cartesian-axis
  // e.g. for tick manipulation, ...

  /**
   * whether to render a color legend
   * @default false (for compatibility reasons)
   */
  display: boolean;

  /**
   * radius range in pixel, the minimal data value will be mapped to the
   * first entry,  the maximal one to the second and a linear interpolation
   * for all values in between.
   *
   * @default [1, 20]
   */
  range: [number, number];

  /**
   * radius to render for missing values
   * @default 1
   */
  missing: number;

  /**
   * orientation of the scale, e.g., `right` means that it is a vertical scale
   * with the ticks on the right side
   * @default bottom
   */
  position: 'left' | 'right' | 'top' | 'bottom';

  /**
   * the property name that stores the value in the data elements
   * @default value
   */
  property: string;

  legend: {
    /**
     * location of the legend on the chart area
     * @default bottom-right
     */
    position: 'left' | 'right' | 'top' | 'bottom' | 'top-left' | 'top-right' | 'top-right' | 'bottom-right';
    /**
     * length of the legend, i.e., for a horizontal scale the width
     * if a value < 1 is given, is it assume to be a ratio of the corresponding
     * chart area
     * @default 90
     */
    length: number;
    /**
     * how wide the scale is, i.e., for a horizontal scale the height
     * if a value < 1 is given, is it assume to be a ratio of the corresponding
     * chart area
     * @default 70
     */
    width: number;
    /**
     * how many pixels should be used for the color bar
     * @default 42
     */
    indicatorWidth: number;
    /**
     * margin pixels such that it doesn't stick to the edge of the chart
     * @default 8
     */
    margin: number;
  }
}
Scales
A new scale projection is registered and used by default by Choropleth and BubbleMap. It provides just one option to specify the projection method. The available methods are the one from https://github.com/d3/d3-geo#projections. Just remove the geo prefix. Alternatively, the projection method instance can be directly given.
interface IProjectionScaleOptions {
  /**
   * projection method used
   * @default albertUsa
   */
  projection: string | Function;
}
Building
npm install
npm run build1 year ago
1 year ago
1 year ago
2 years ago
2 years ago
2 years ago
3 years ago
2 years ago
3 years ago
2 years ago
2 years ago
3 years ago
3 years ago
3 years ago
3 years ago
3 years ago
3 years ago
3 years ago
3 years ago
3 years ago
3 years ago
4 years ago
4 years ago
4 years ago
4 years ago
4 years ago
4 years ago
4 years ago
4 years ago
5 years ago
5 years ago
5 years ago
5 years ago
5 years ago
5 years ago
5 years ago
5 years ago
5 years ago
5 years ago
5 years ago
5 years ago
5 years ago
6 years ago
6 years ago
6 years ago
6 years ago
6 years ago
6 years ago
6 years ago
6 years ago
6 years ago
6 years ago
6 years ago
6 years ago
6 years ago
6 years ago