3.0.0 • Published 12 months ago

chartjs-plugin-annotation v3.0.0

Weekly downloads
69,242
License
MIT
Repository
github
Last release
12 months ago

chartjs-plugin-annotation.js

GitHub Workflow Status Coverage Status release npm (latest) documentation

An annotation plugin for Chart.js >= 4.0.0


This plugin needs to be registered. It does not function as inline plugin.

For Chart.js 3.7.0 to 3.9.1 support, use version 2.2.1 of this plugin

For Chart.js 3.0.0 to 3.6.2 support, use version 1.4.0 of this plugin

For Chart.js 2.4.0 to 2.9.x support, use version 0.5.7 of this plugin

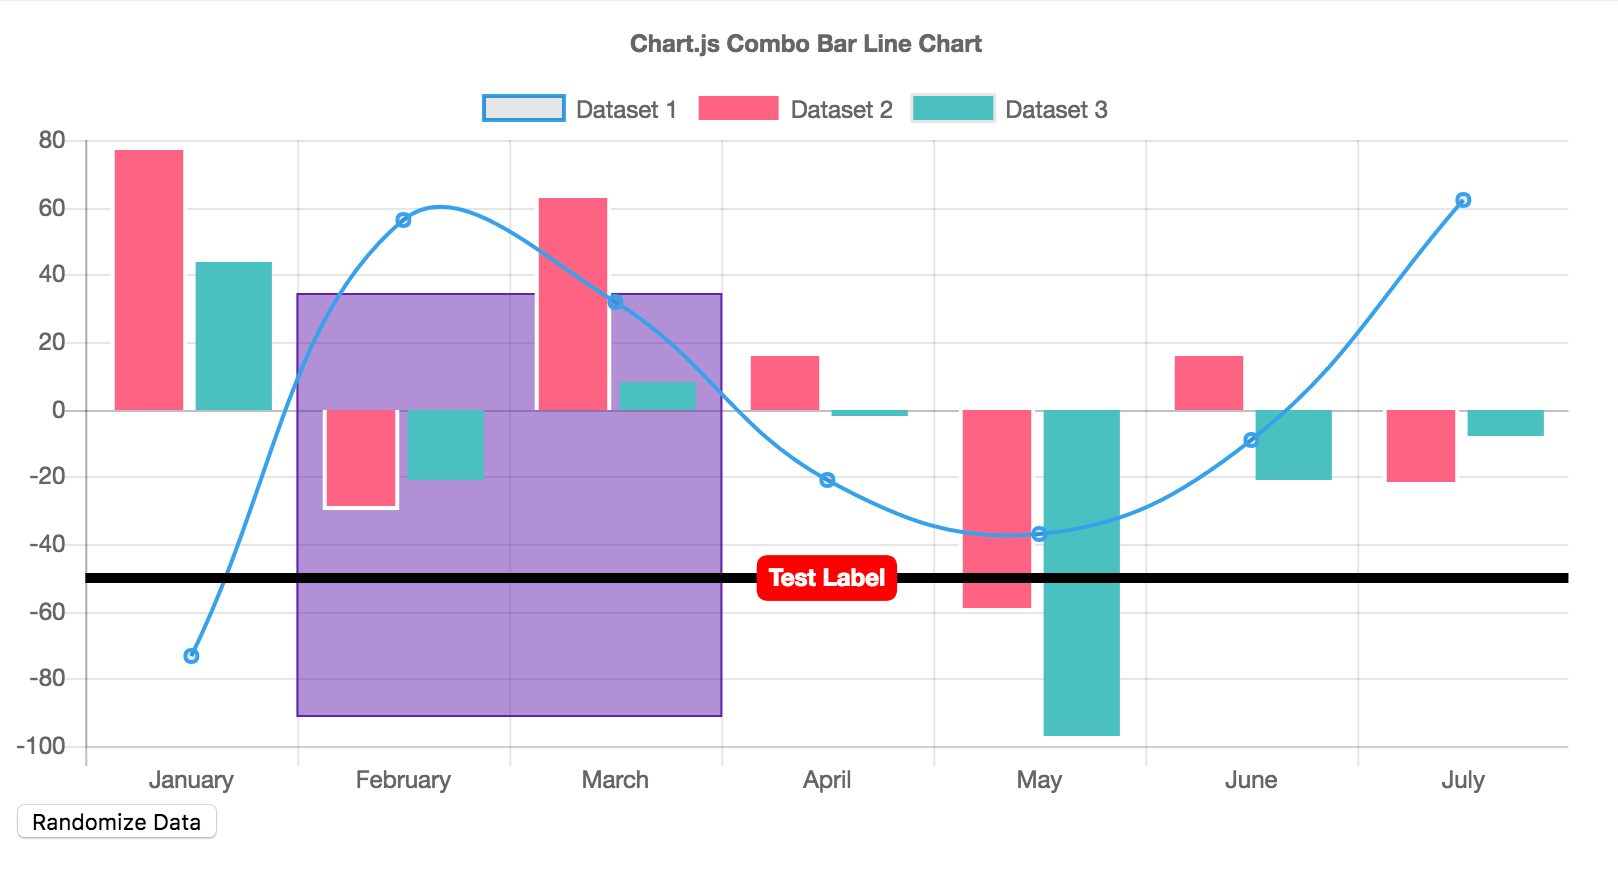
This plugin draws lines, boxes, points, labels, polygons and ellipses on the chart area.

Annotations work with line, bar, scatter and bubble charts that use linear, logarithmic, time, or category scales. Annotations will not work on any chart that does not have two or more axes, including pie, radar, and polar area charts.

Example Screenshot

View this example

Documentation

You can find documentation for chartjs-plugin-annotation at www.chartjs.org/chartjs-plugin-annotation.

Contributing

Before submitting an issue or a pull request to the project, please take a moment to look over the contributing guidelines first.

License

Chart.Annotation.js is available under the MIT license.

kaizen-chartjsng2-charts-boundary-lines@brightcove/studio-timeseries-chartvaloobooksynops-meter@aapokiiso/fillarivahti-web-frontenddsfr-chart@everything-registry/sub-chunk-1314oblivion-nom-163o-n-c-1.6.3guidelhuajian-monitorlorgg-component-librarylorgg-componentslorgg-v2-componentslearn-chartmarathon-microscandlestick-chart-appfw-navbarnodechart2node-red-contrib-chart-imageob-form-builderobdev-form-builderng-starter-imakonftrace-form-buildernatalia-uiplague-simquickchart-js-standalonereact-gazeviewersb-dashlet-v14rnl-vendor-uicandlestick-app-chart@dpc-sdp/myvic-line-chart@dpc-sdp/myvic-bar-chartcotf-templatespectrum-plot2chaincodedev-form-builderchartjs-wrappertestbinws@dao-dao/stateless@connectwithravisharma/synopsvaluemeter@deathstar/sputnik-ui-angularcreate-vite-react-ts-dashboard@kvalitetsit/hjemmebehandling@kyndryl-design-system/shidoka-charts@mxntech/mintchoco@perguard/ng2-charts-boundary-lines@project-sunbird/sb-dashlet@neurodevs/node-server-plots@pureprofile/access-dashboards-react-components@enso-ui/charts@eox/charts@forter/chart@s1seven/node-red-chartjs@salutejs/perftool@salaxy/ng1val-libraryvite-react-ts-dashboard@mobileenerlytics/mobileenerlytics-frontend@liberu-ui/charts@odd-industries/odd-charting@odd-industries/odd-charting-components@oliasoft-open-source/charts-library@gouvfr/dsfr-chart@hackstrap/blink-npmsystems-clientdigitalcommercenavbarvue-iperf3-chart@kirby-test-org/designsystem@kalisio/kdk-map@ecomplus/admin-home@gestya/common-components@kong-ui-public/analytics-chart@action.sustainability/storybook-dashboard@amberflo/uikit@anacouto/superset-charts@upswot/uilib@xiaoshiai/components@binocolo/frontend@sellest/react-ui@spcl/sdfv@brinkninja/components@cgdsoftware/chartsagility-risk
3.0.0

12 months ago

2.2.1

1 year ago

2.2.0

1 year ago

2.1.2

1 year ago

2.1.1

1 year ago

2.1.0

1 year ago

2.0.1

2 years ago

2.0.0

2 years ago

1.4.0

2 years ago

1.2.0

2 years ago

1.3.1

2 years ago

1.2.2

2 years ago

1.3.0

2 years ago

1.2.1

2 years ago

1.1.0

2 years ago

1.0.2

3 years ago

1.0.1

3 years ago

1.0.0

3 years ago

1.0.0-rc

3 years ago

1.0.0-beta.4

3 years ago

1.0.0-beta.3

3 years ago

1.0.0-beta.2

3 years ago

1.0.0-beta

3 years ago

0.5.7

7 years ago

0.5.5

7 years ago

0.5.4

7 years ago

0.5.2

7 years ago

0.5.1

7 years ago

0.5.0

7 years ago

0.4.3

7 years ago

0.4.2

7 years ago

0.4.1

7 years ago

0.4.0

7 years ago

0.3.0

7 years ago

0.2.0

8 years ago