covidvizualizer v1.0.90
TABLE OF CONTENTS
INTRODUCTION A NPM that plots and displays the Covid-19 information in the Browser. This package also returns the information that is being used for the rendering purposes. Check out this video to see the demo.
USAGE

<div id="covidVizualizerDiv" style="width: 1024px; height: 512px;">
  <select id="countriesList"></select>
  <select id="provincesList"></select>
  <h3 id="covidInfo"></h3>
  <div id="covidMapArea"></div>
</div>
SPECIFICATIONS
SOFTWARES REQUIRED The software that are needed for the application to be edited or executed
SOURCE CODE\ The Source code for the application is in the 'CovidVizualizer' folder
INSTALLATION NOTES\ Use the following command to install the CovidVizualizer NPM package in your project.
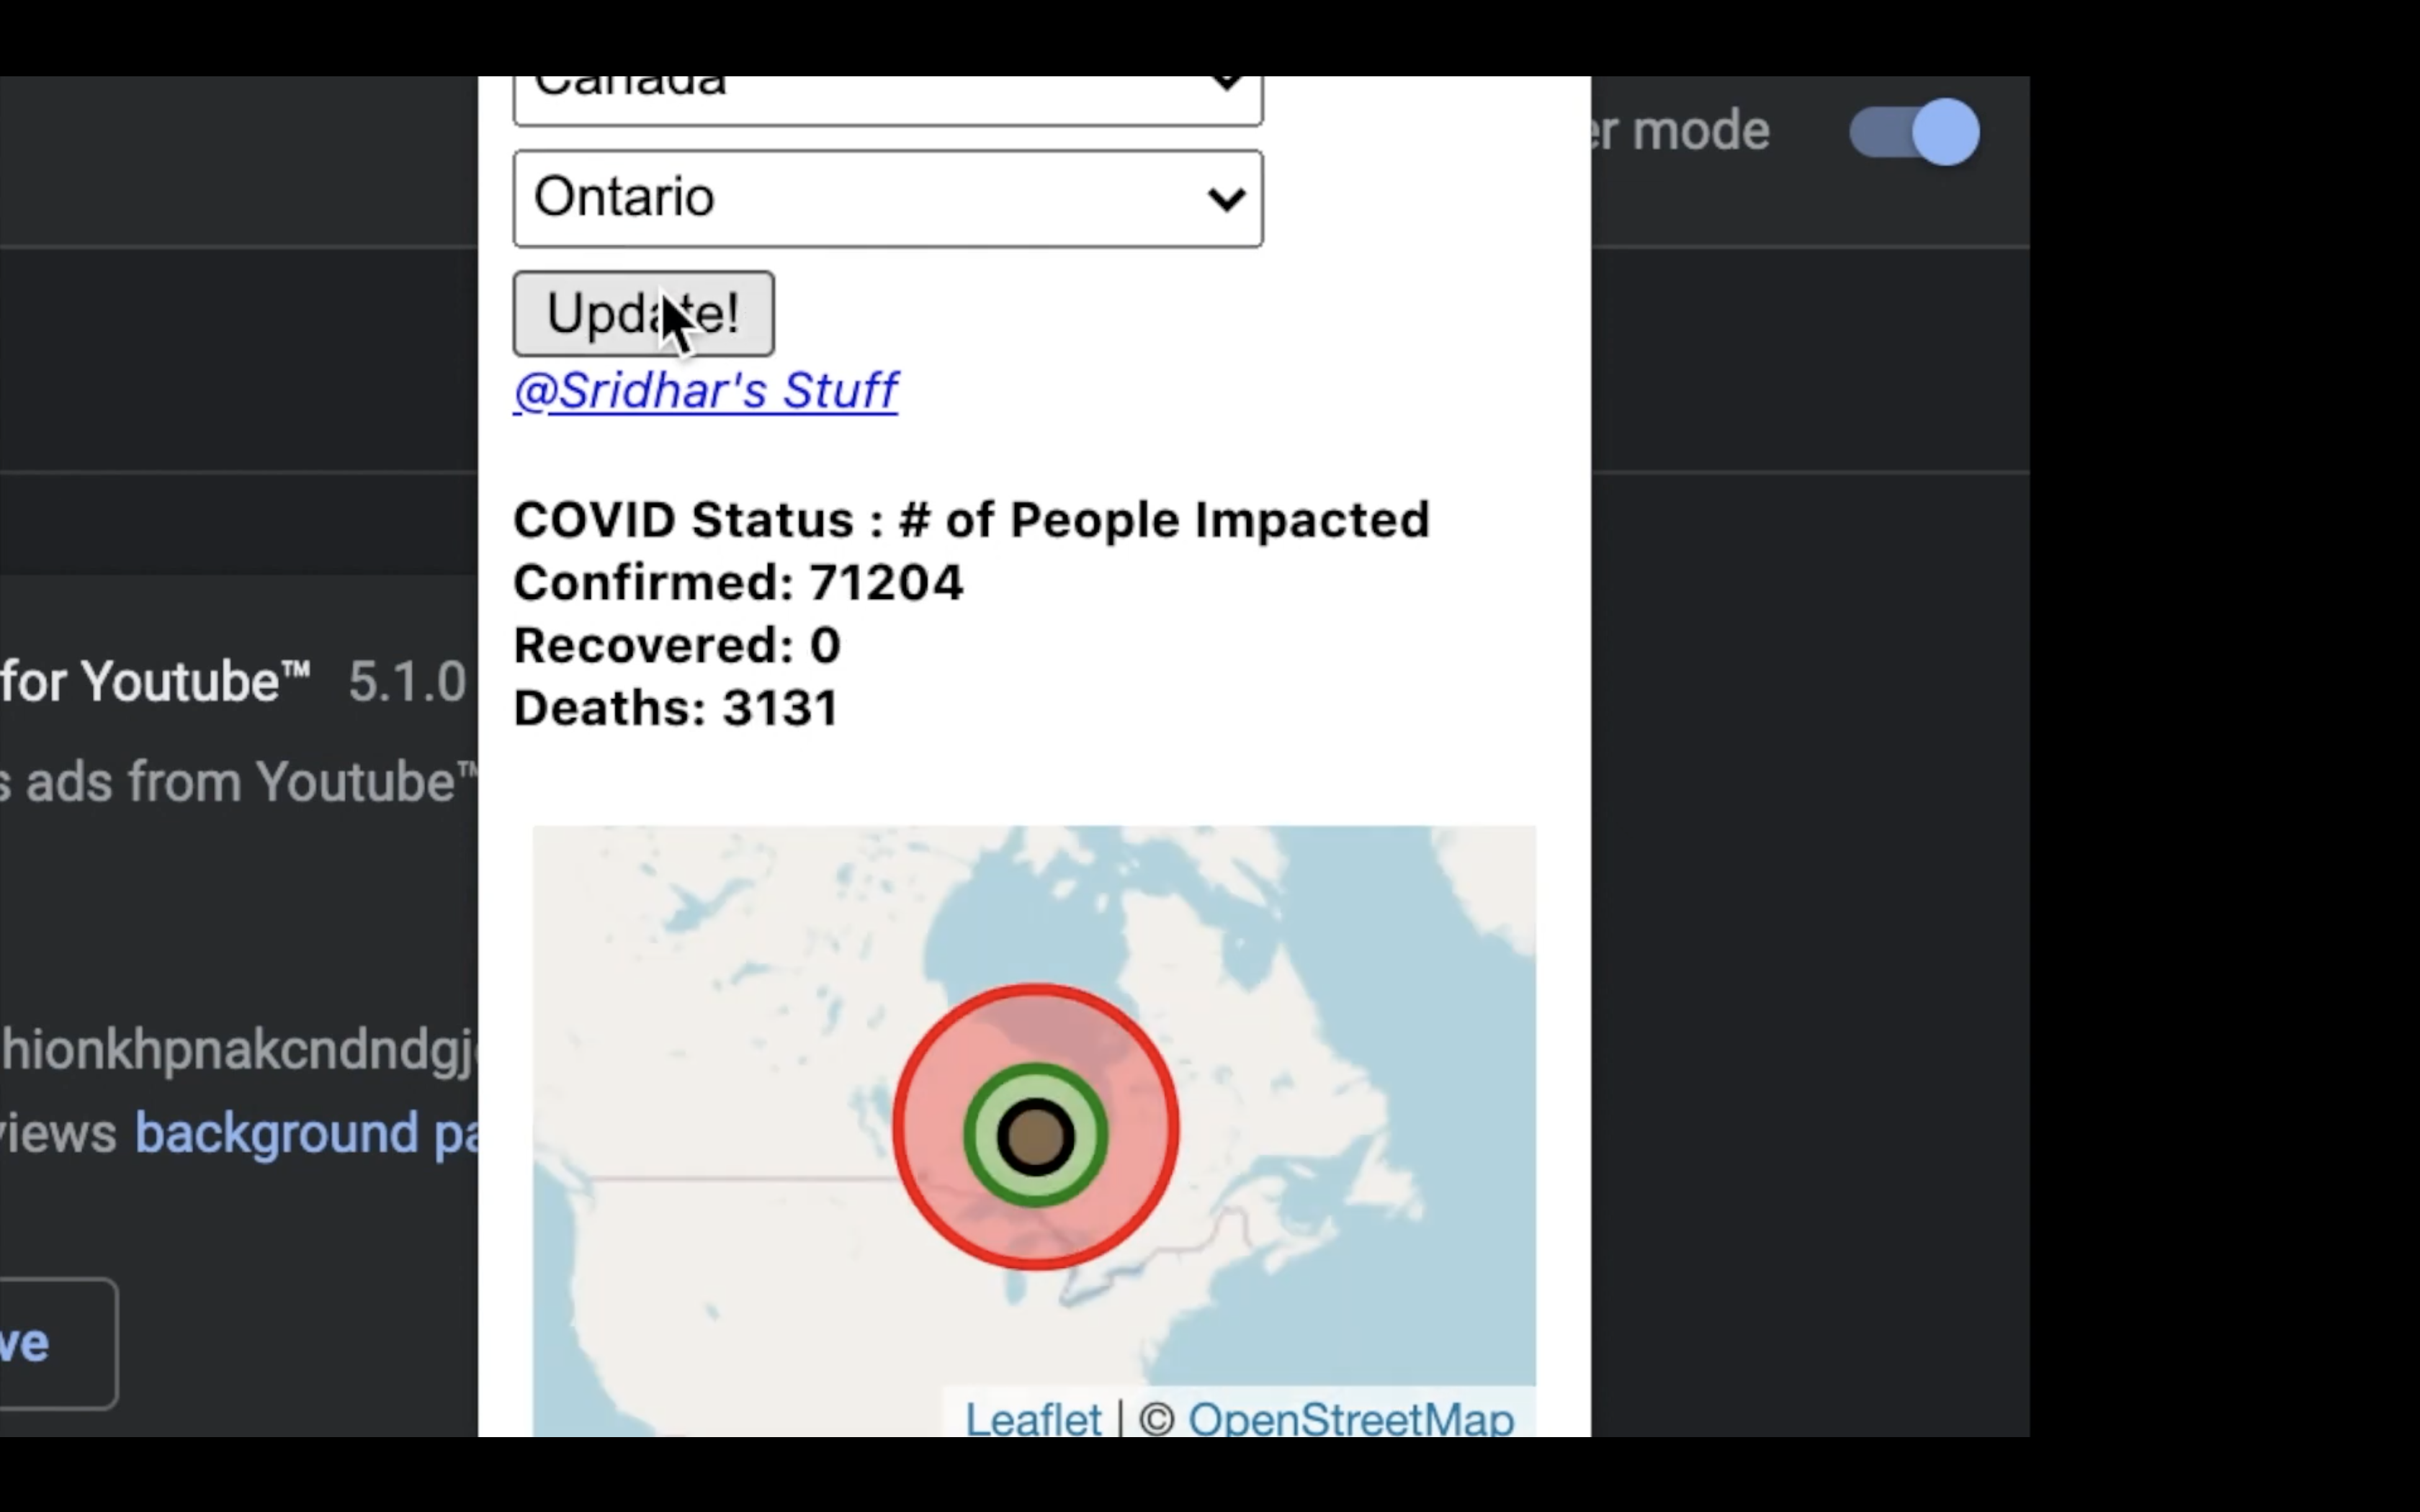
ABOUT THE APPLICATION\ This application loads the list of Country names and Province namesif available and render the COVID-19 information in the UI upon the completion of the steps specified in the ‘INSTALLATION NOTES’ section.
The application loads the dropdown for CountriesList with the "Choose your Country" dropdown text selected by default. Figure 1 shows the screen when the package is loaded.

Figure 1: Start-up Screen
Figure 2: UI when the country is selected - 'dark' theme.
Figure 3: UI after a province is selected - 'dark' theme.
Figure 4: Display of the Map with 'light' theme.
Figure 4: Display of the Logs in the browser console when 'showLogs' is set to true.