0.2.0-rc.2 • Published 7 years ago
higlass-time-interval-track v0.2.0-rc.2
Time Interval Track for HiGlass
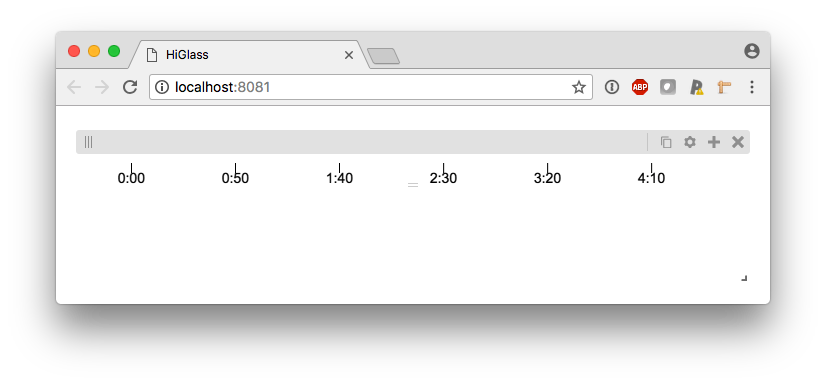
Display time intervals in the format HH:MM:ss in HiGlass.

Note: This is the source code for the time interval track only! You might want to check out the following repositories as well:
- HiGlass viewer: https://github.com/hms-dbmi/higlass
- HiGlass server: https://github.com/hms-dbmi/higlass-server
- HiGlass docker: https://github.com/hms-dbmi/higlass-docker
Installation
npm install higlass-time-interval-trackUsage
- Make sure you load this track prior to
hglib.js. For example:
<script src="higlass-time-interval-track.js"></script>
<script src="hglib.js"></script>
<script>
  ...
</script>
2 Make sure that your server is hosting a htime file. This file should contain start, end and length which indicate the start time, end time, and the length of the data points that span that time interval.
{
  "start": 1527700333497.325,
  "end": 1527700926756.7783,
  "len": 59340
}
This will place the first time interval at data position 0 and the last at data position 59340. Each data point is thus assumed to last 10 milliseconds.
- Configure the track in your view config and be happy! Cheers 🎉
{
  ...
  {
    server: 'http://localhost:8001/api/v1',
    tilesetUid: 'time-interval.json',
    uid: 'blah',
    type: 'time-interval-track',
    options: {

    },
  },
  ...
}
Take a look at src/index.html for an example.
Development
Installation
$ git clone https://github.com/pkerpedjiev/higlass-time-interval-track
$ npm install
Commands
Developmental server: npm start
Production build: npm run build

