1.0.5 • Published 8 years ago
interactive-scatterplots v1.0.5
interactive-scatterplots

Installation
npm install interactive-scatterplotsAPI
import scatter from 'interactive-scatterplots'

const svg = scatter.plot(data, x, y[, options])
Parameters
dataan array of rowsxa column name string or function specifying which data to use on the x axisya column name string or function specifying which data to use on the y axis
Options
The options object can be used to set a number of options. Wherever functions are passed in, they take as their parameter the current data row.
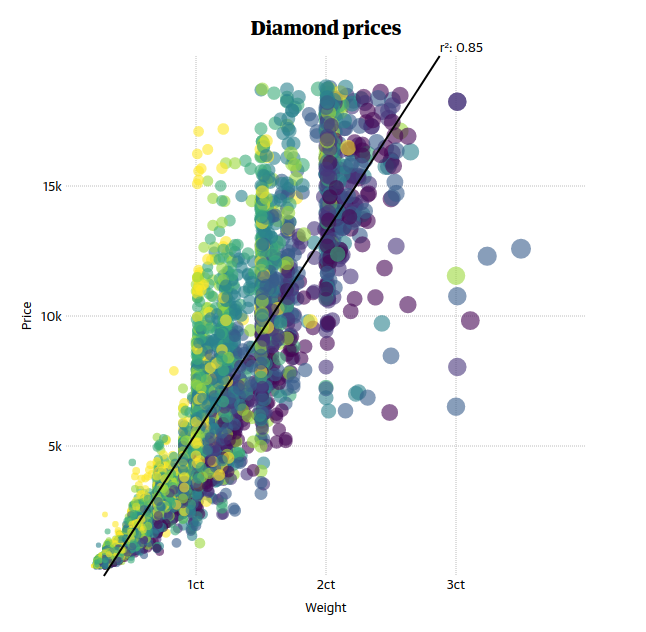
width(number)heightpaddingpadding around the chart's grid to fit axis labels and chart title. Object withtop,right,bottomandleftpropertiestitlethe chart's titlerthe (constant) radius for each circlerScalea column name string or function to dynamically scale circle radii between 0 andrinsteadida column name string or function to use asdata-idproperty on each circle, associated label and voronoi polygonxExtent/yExtentthe extent (data domain) of the chart in either dimensionxStops/yStopsthe values at which to draw grid lines in the backgroundxLabel/yLabelthe labels describing the two axesyLabelRightwhether to move the y axis' title to the right hand side of the chartclassCirclesa function returning a class string for each circlestyleCirclesa function returning a CSS properties object for each circlelabela function returning a circle's label string, ornullif it shouldn't be labelledfitLinewhether to draw a line of best fitvoronoiwhether to compute and draw a voronoi grid overlay- ... full docs to follow
Default styles
These can be found in dist/scatter.css. To import them in Sass:
@import 'node_modules/interactive-scatterplots/dist/scatter';