4.14.3 • Published 5 years ago
jupyterlab-chart-editor v4.14.3
jupyterlab-chart-editor
A JupyterLab extension for editing Plotly charts, based on https://github.com/plotly/react-chart-editor

Prerequisites
- JupyterLab >= 1.2
- plotly.py >= 4.4
Install
jupyter labextension install jupyterlab-chart-editorUsage
Create and display a figure
import plotly.graph_objs as go
import plotly.io as pio

fig = go.Figure()
fig.add_scatter(y=[2, 4, 3, 2.5])
fig.show()
Write figure to JSON
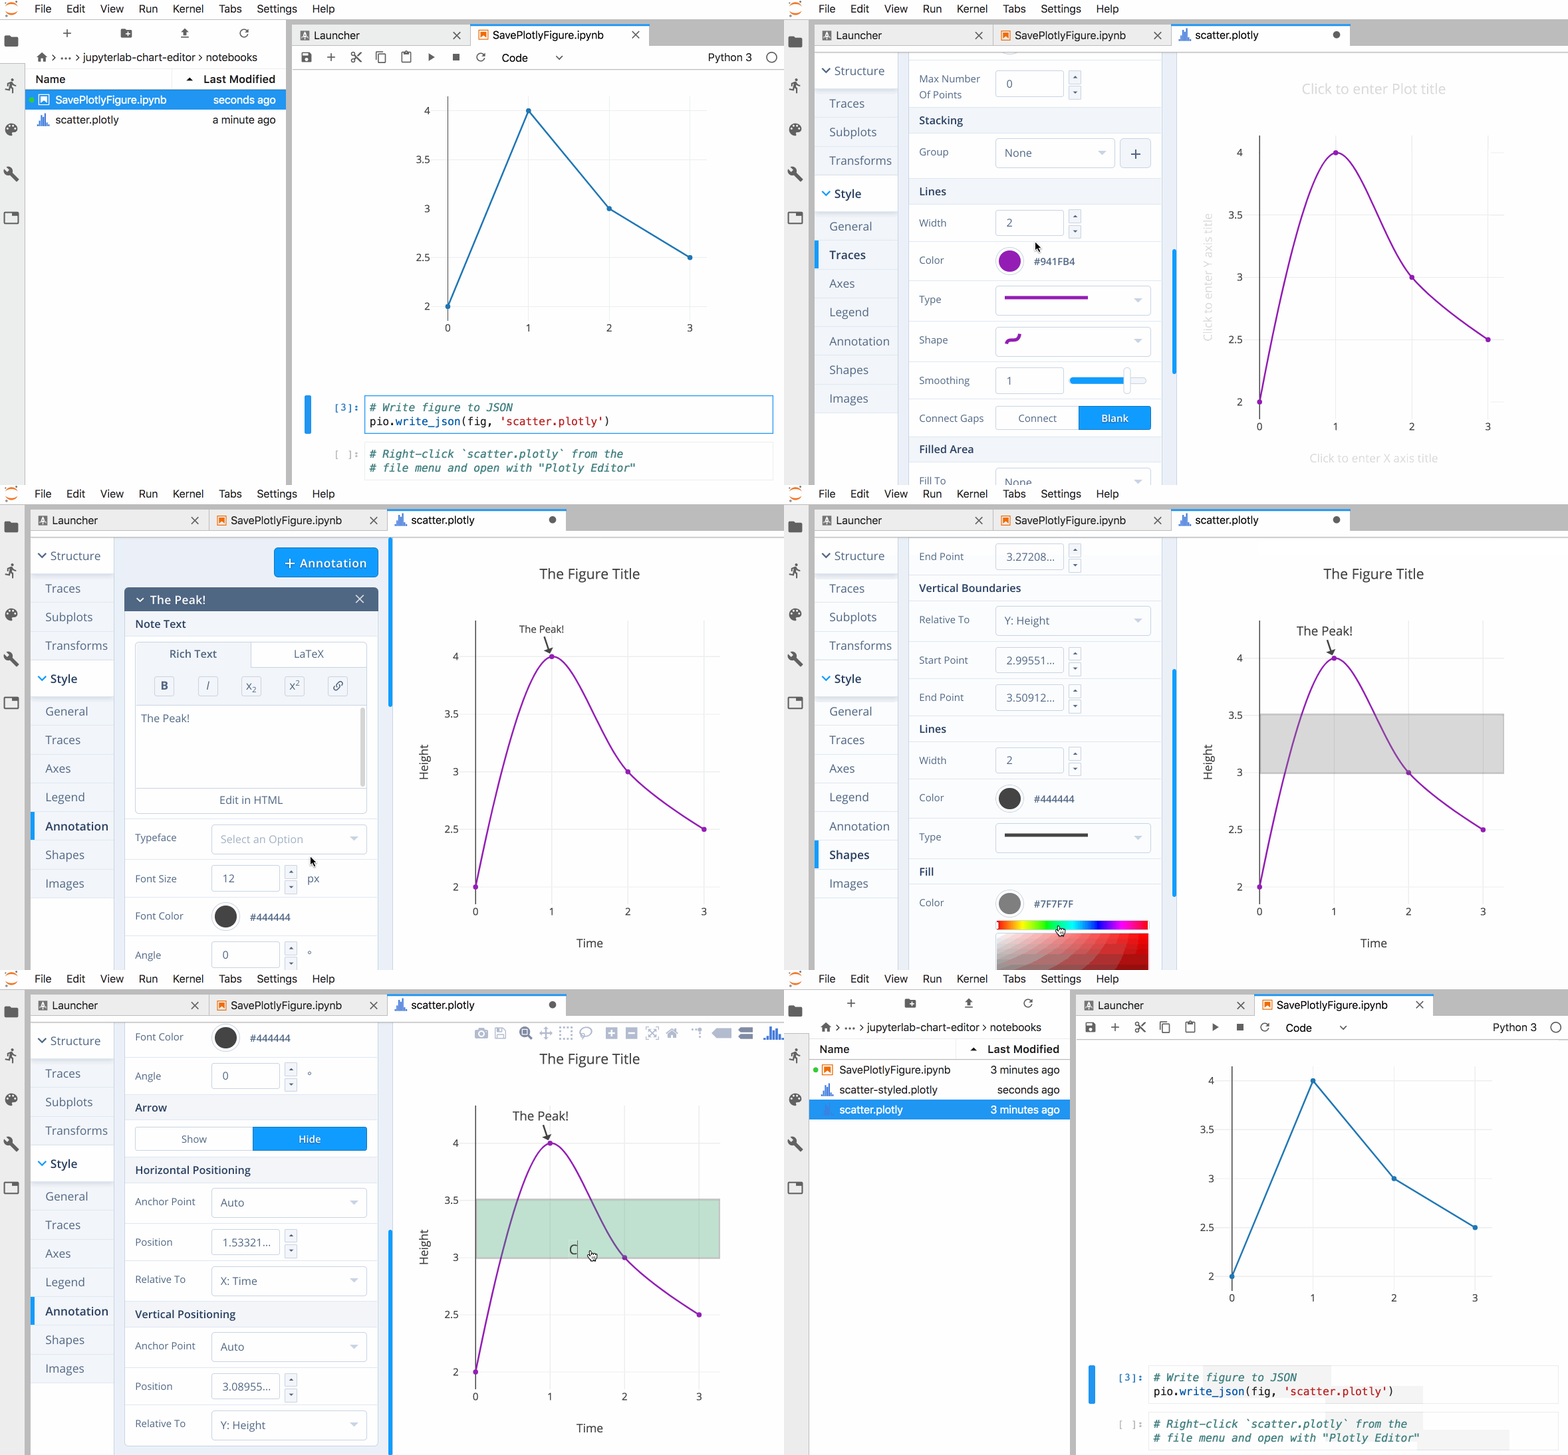
pio.write_json(fig, 'scatter.plotly')Right-click scatter.plotly from the file menu and open with "Plotly Editor". Make some changes to the figure, then use the file menu to save as scatter-styled.plotly.
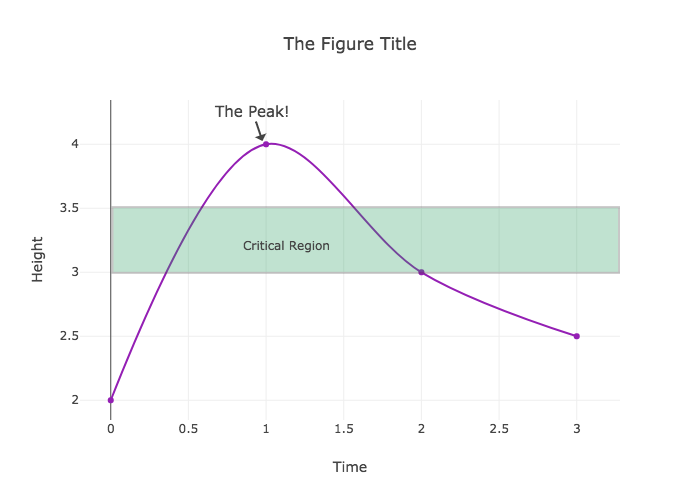
Then import scatter-styled.plotly back into plotly.py
fig_styled = pio.read_json('scatter-styled.plotly')
fig_styled
Uninstall
jupyter labextension uninstall jupyterlab-chart-editor