0.4.0 • Published 5 years ago
leaflet-temporal-geojson v0.4.0
leaflet-temporal-geojson 

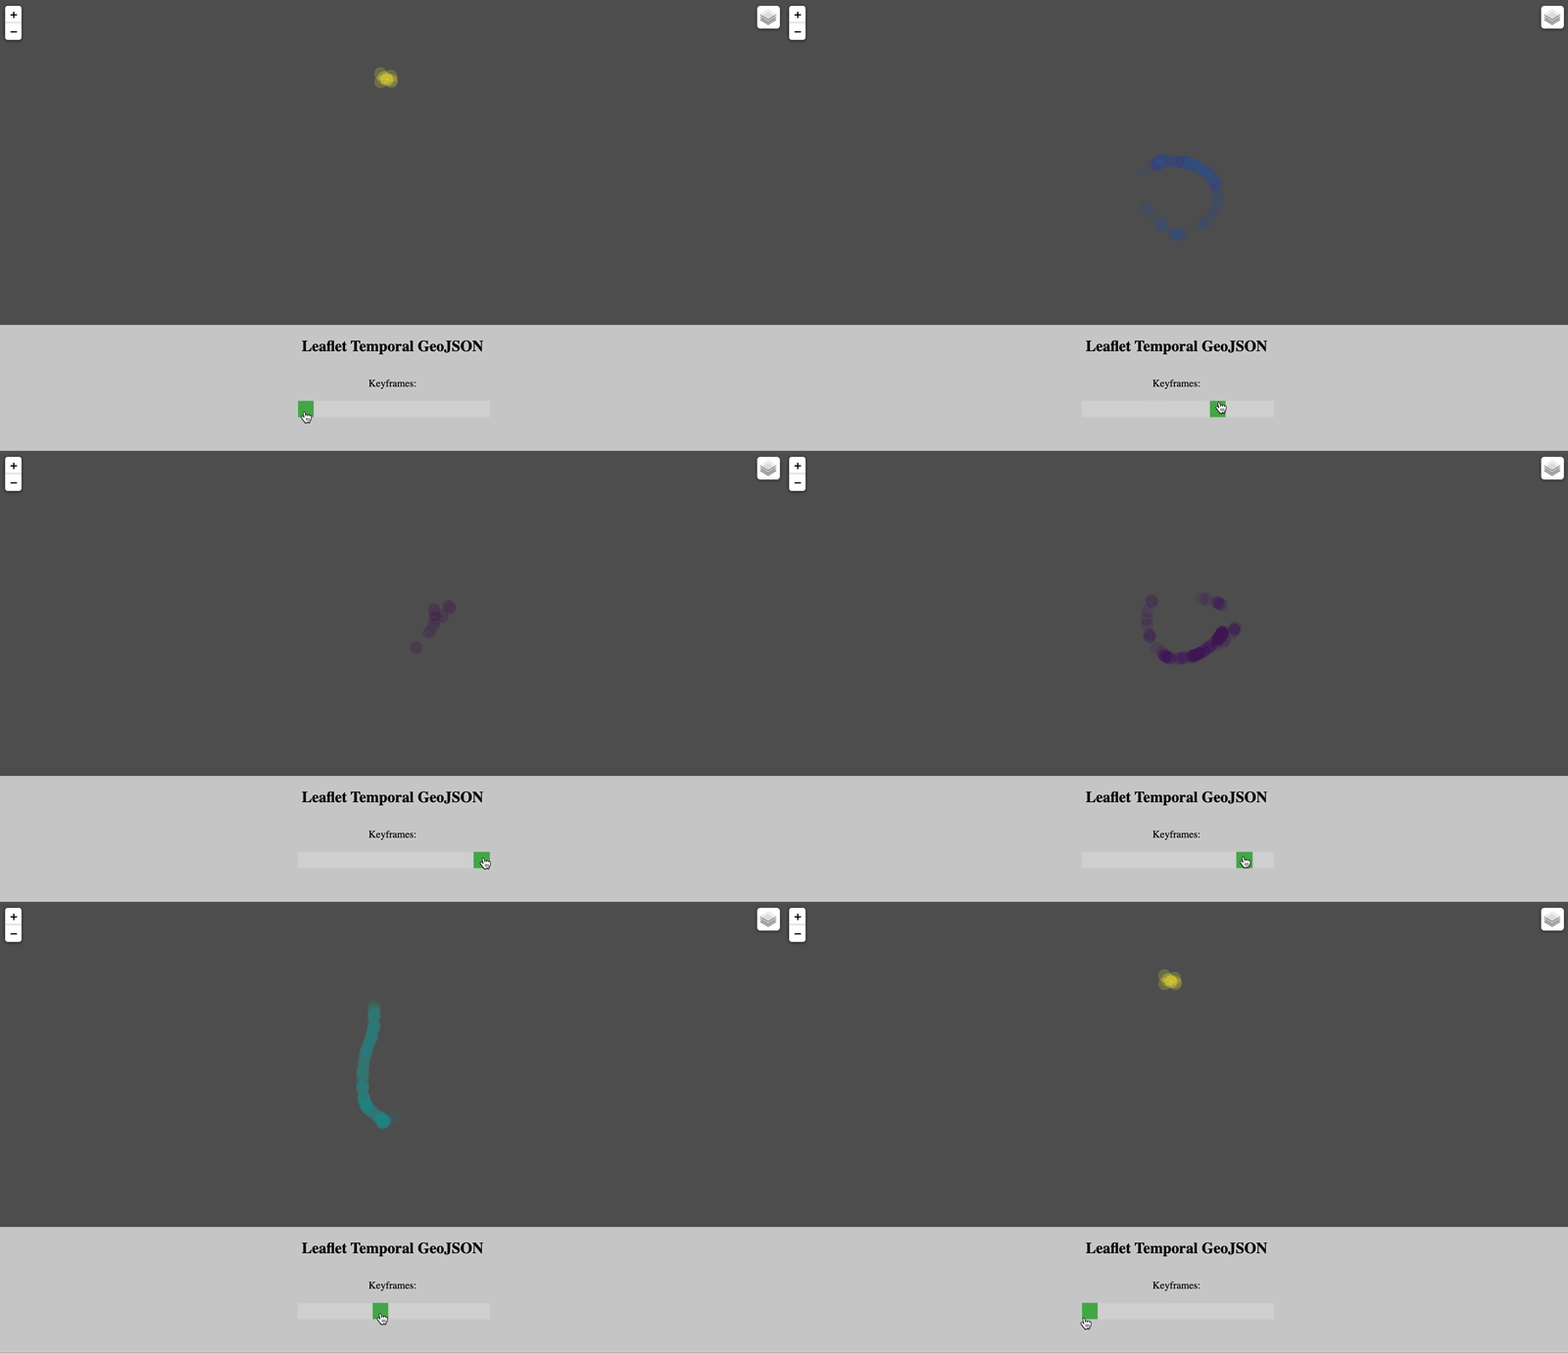
A somewhat unopinionated leaflet (v1+) plugin to animate GeoJSON features using an arbitrary time property:
- You decide how to change frames (event driven range slider components, methods calls, whatever 🤷♂️)
- You control feature styling (static, dynamic, whatever 🤷♀️)

how does it work
- features are clustered into layer 'keyframes' using supplied time property
- keyframes are rendered depending on time key
- features may have custom styles applied using properties
notes
- to improve rendering performance, points are rendered as
L.circleMarkervectors using L.geoJSON'spointToLayerfunction (i.e. to avoid use of DOM<img>for markers)
install
npm install leaflet-temporal-geojson --savedevelopment
npm install
npm run build
use and options
See demo for detailed example.
const layer = L.temporalGeoJSONLayer({

  // which property to use for time (expects ISO 8601 string)
  timeKey: "time",

  // optional function to return style
  // see path options: https://leafletjs.com/reference-1.6.0.html#path-option
  style: function(feature) {
    return {};
  },

  // array of geojson features
  features: [
    {
      "type": "Feature",
      "properties": {
        "age": 1,
        "time": "2005-08-22T09:01:00Z"
      },
      "geometry": {
        "type": "Point",
        "coordinates": [
          156,
          -45
        ]
      }
    },
  ],

  // OPTIONAL - supply the name of a custom pane,
  // will be created if doesn't exist, defaults to overlayPane
  // https://leafletjs.com/reference-1.6.0.html#map-pane
  paneName: 'myCustomPane',

  // OPTIONAL - additional options to style point data (e.g. radius)
  // this has lower priority than styles from style()
  // https://leafletjs.com/reference-1.6.0.html#circlemarker
  circleMarkerOptions: {},

  // OPTIONAL - renderer factory
  // One of: L.canvas, L.svg (defaults to canvas)
  // Note: L.svg is not recommended due to performance overhead
  rendererFactory: L.canvas,

  // OPTIONAL - callbacks when layer is added/removed from map
  onAdd: function(){},
  onRemove: function(){},

  // OPTIONAL - function to control feature popups
  // https://leafletjs.com/reference-1.6.0.html#geojson
  popupFunction(layer) {
    return `the time here is: ${layer.feature.properties.time}`
  }

});
public methods
| method | params | description |
|---|---|---|
getFrame | Get the current frame time (-1 if not set) | |
getFrameKeys | Get an ascending array of all ISO times (can then be used to call setFrame) | |
isActive | check if the layer is currently active on the map | |
setFrame | time: {string} | display the features at the given ISO time (if calling from something like a range slider, recommended to throttle - see demo). |
setStyle | style: {function} | Changes styles of GeoJSON vector layers with the given style function. Set falsey for defaults. |
getBounds | time {string} | Get the bounds at given time (falls back to bounds of current keyframe, and then bounds of first keyframe if not set). |
example data
The included example data is fictional and intended for demonstration purposes only, however - if you're interested in marine connectivity modelling you should check out some of CSIRO's work on connectivity modelling here, and here.