native-f2charts


install
$ npm install native-f2charts --save
Usage
The Usage is complete consistent with F2charts
component props:
- option (object): The option for f2charts: Documentation。
- width (number): The width of the chart. The default value is the outer container width.
- height (number): The height of the chart. The default value is 400.
import React, { Component } from 'react';
import {
  StyleSheet,
  Text,
  View,
  TouchableOpacity
} from 'react-native';
import F2charts from 'native-f2charts';

export default class App extends Component {
  static navigationOptions = ({ navigation }) => ({
    title: `Line (Column) - Basic`,
  });
  constructor(props) {
    super(props);
    const data = [
      { time: '2016-08-08 00:00:00', tem: 10 },
      { time: '2016-08-08 00:10:00', tem: 22 },
      { time: '2016-08-08 00:30:00', tem: 20 },
      { time: '2016-08-09 00:35:00', tem: 26 },
      { time: '2016-08-09 01:00:00', tem: 20 },
      { time: '2016-08-09 01:20:00', tem: 26 },
      { time: '2016-08-10 01:40:00', tem: 28 },
      { time: '2016-08-10 02:00:00', tem: 20 },
      { time: '2016-08-10 02:20:00', tem: 28 }
    ];
    this.state = {
      data,
      option : `
        var data = ${JSON.stringify(data)};
        var defs = {
          time: {
            type: 'timeCat',
            mask: 'MM/DD',
            tickCount: 3,
            range: [ 0, 1 ]
          },
          tem: {
            tickCount: 5,
            min: 0
          }
        };
        /* 配置刻度文字大小,供PC端显示用(移动端可以使用默认值20px) */
        chart.axis('tem', {
          label: {
            fontSize: 14
          }
        });
        chart.axis('time', {
          label: {
            fontSize: 14
          }
        });
        chart.source(data, defs);
        chart.line().position('time*tem');
        chart.render();`,
      text: 'test'
    };
  }

  changeOption() {
    const data = [
      { time: '2016-08-08 00:00:00', tem: 10 },
      { time: '2016-08-08 00:10:00', tem: 22 },
      { time: '2016-08-08 00:30:00', tem: 20 },
      { time: '2016-08-09 00:35:00', tem: 26 },
      { time: '2016-08-09 01:00:00', tem: 20 },
      { time: '2016-08-09 01:20:00', tem: 26 },
      { time: '2016-08-10 01:40:00', tem: 28 },
      { time: '2016-08-10 02:00:00', tem: 20 },
      { time: '2016-08-10 02:20:00', tem: 90 }
    ];
    this.setState({
      data,
      option : `
        var data = ${JSON.stringify(data)};
        var defs = {
          time: {
            type: 'timeCat',
            mask: 'MM/DD',
            tickCount: 3,
            range: [ 0, 1 ]
          },
          tem: {
            tickCount: 5,
            min: 0
          }
        };
        /* 配置刻度文字大小,供PC端显示用(移动端可以使用默认值20px) */
        chart.axis('tem', {
          label: {
            fontSize: 14
          }
        });
        chart.axis('time', {
          label: {
            fontSize: 14
          }
        });
        chart.source(data, defs);
        chart.line().position('time*tem');
        chart.render();`,
    })
  }
  render() {
    return (
      <View style={styles.container}>
        <Text style={styles.welcome}>
          Welcome to React Native F2charts
        </Text>
        <TouchableOpacity style={styles.button} onPress={this.changeOption.bind(this)}>
          <Text style={{color: '#fff'}}>change state</Text>
        </TouchableOpacity>
        <F2charts option={this.state.option} height={300} width={330} datasource={this.state.data}/>
        </View>
    );
  }
}

const styles = StyleSheet.create({
  container: {
    flex: 1,
    justifyContent: 'center',
    alignItems: 'center',
    backgroundColor: '#F5FCFF',
  },
  welcome: {
    fontSize: 20,
    textAlign: 'center',
    margin: 30,
  },
  button: {
    backgroundColor: '#d9534f',
    padding: 8,
    borderRadius: 4,
    marginBottom: 20
  }
});

AppRegistry.registerComponent('app', () => app);
##Example
run demo
cd native-f2-demo
npm install
npm start
IOS
Open the xcode project in the ios directory and click run
screenshots:
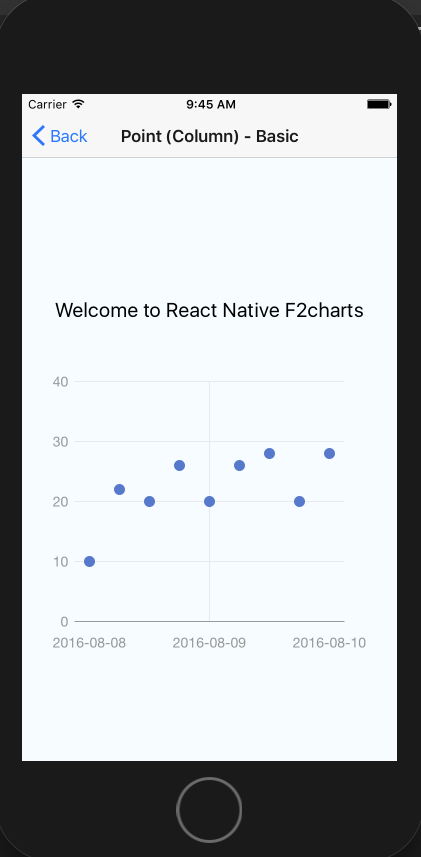
Android
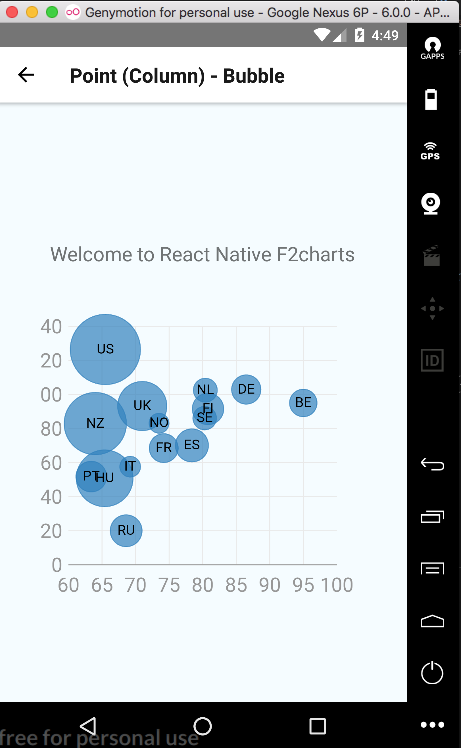
Open the Android project in the android directory with Android Studio and click run.
screenshots:
License
native-f2charts is released under the MIT license.