ngx-leaflet-gridlayer v1.0.0
ngx-leaflet-gridlayer
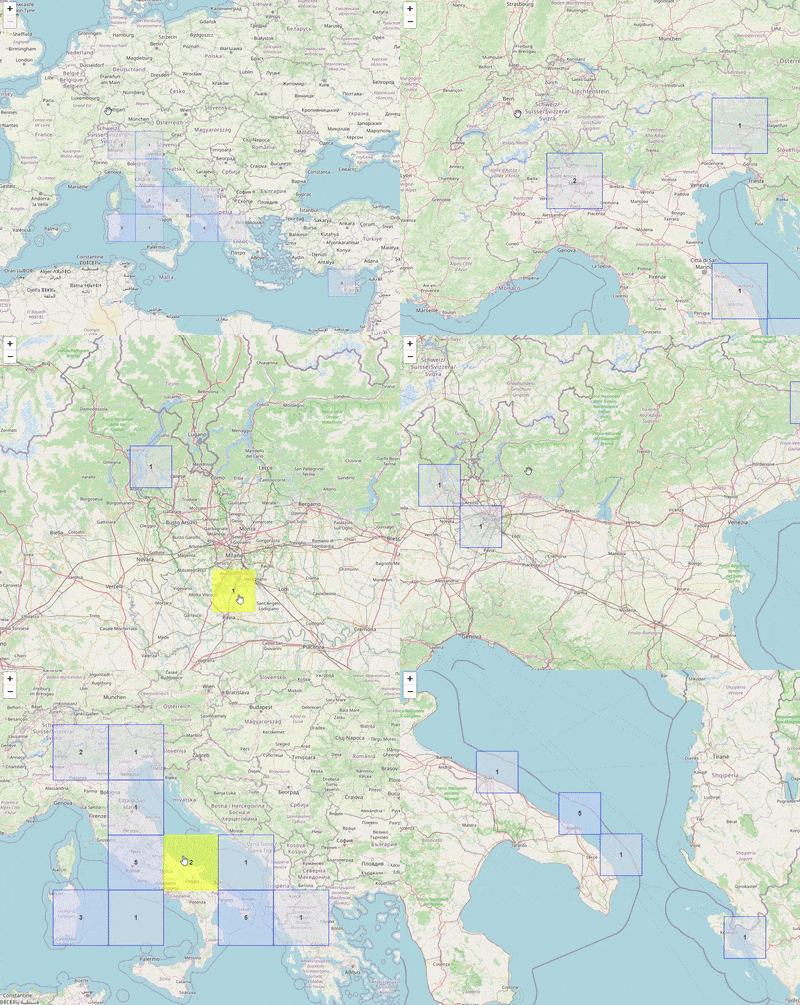
This is a library for angular in support of @asymmetrik/ngx-leaflet to facilitate the process of building grid layers on top of the map and visualize aggregator data on each tile. The library aims to remove the burden of such tasks while keeping the performance and being responsive.
Demo

Installation
Install ngx-leaflet-gridlayer with npm
npm install ngx-leaflet-gridlayerImport 'NgxLeafletGridlayerModule' in the module you are using the map or top module.
import { NgxLeafletGridlayerModule } from 'ngx-leaflet-gridlayer';

@NgModule({
  declarations: [
    // ...
  ],
  imports: [
    // ...
    NgxLeafletGridlayerModule
  ],
  providers: [],
  bootstrap: [AppComponent]
})
In the component where this should be integrated import 'NgxLeafletGridlayerService'.
import { NgxLeafletGridlayerService } from 'ngx-leaflet-gridlayer';

// Add map property which will hold the map reference
map!: Map;

// Add the service in the constructor for use
constructor(private _gridlayerService: NgxLeafletGridlayerService) {}

// onMapReady is a method that is triggered when the map is ready, so use it to get the reference to the map and pass it to createGridLayer() together with the data which should be of type InputData.
onMapReady(map: Map): void {
    this.map = map;
    this._gridlayerService.createGridLayer(inputData, this.map)
};
Data type
The service should be supplied with data of the following format:
interface InputData {
    data: Data[],
    tileOutlineColor: string,
    backgroundColor: {
        fewItems: {
            numberOfItems: number,
            backgroundColor: string
        },
        someItems: {
            numberOfItems: number,
            backgroundColor: string
        },
        manyItems: {
            numberOfItems: number,
            backgroundColor: string
        }
    },
    hoverBackgroundColor: string,
    hoverOutlineColor: string,
}

interface Data {
  title: string,
  description: string,
  boundingCoordinates: BoundingCoordinates,
}

interface BoundingCoordinates {
  eastBoundingCoordinate: number,
  westBoundingCoordinate: number,
  northBoundingCoordinate: number,
  southBoundingCoordinate: number
};
where different color can be provided for different total number of items as well as the number itself.
Here is an example of data:
data= {
  tileOutlineColor: 'red',
  backgroundColor: {
    fewItems: {
      numberOfItems: 3,
      backgroundColor: 'green'
    },
    someItems: {
      numberOfItems: 6,
      backgroundColor: 'purple'
    },
    manyItems: {
      numberOfItems: 9,
      backgroundColor: 'yellow'
    }
  },
  hoverBackgroundColor: 'brown',
  hoverOutlineColor: 'orange',
  data: [
    {
      title: 'test1',
      description: 'test2',
      boundingCoordinates: {
        eastBoundingCoordinate: 18,
        westBoundingCoordinate: 22,
        northBoundingCoordinate: 17,
        southBoundingCoordinate: 16
      }
    },
    {
      title: 'test1',
      description: 'test2',
      boundingCoordinates: {
        eastBoundingCoordinate: 30,
        westBoundingCoordinate: 40,
        northBoundingCoordinate: 35,
        southBoundingCoordinate: 64
      }
    }
  ]
}
Authors
Contributing
Contributions are always welcome!
See contributing.md in the repo for more details.
Please adhere to this project's code of conduct.
License
See LICENSE in repository for details.