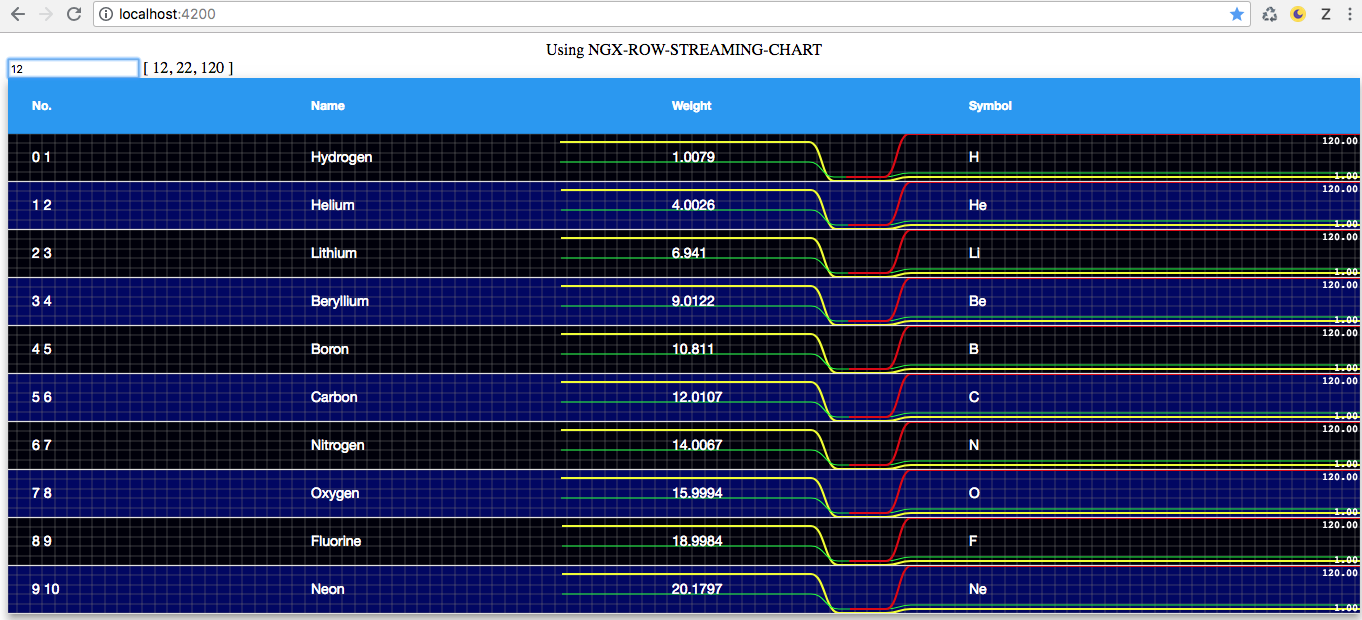
ngx-row-streaming-chart v0.0.2
NxMagicRow
Example

How to use it?
Simplest way (1 serie):
insert the element in the first column of your table
...
<td mat-cell *matCellDef="let element;let i=index">
  <ngx-row-streaming-chart
  [values]="dynValues"
  ></ngx-row-streaming-chart>
  ...
</td>
...
component
...
dynValues = [10]
Extra configs and 3 series:
       <ngx-row-streaming-chart
         series="3"
         [seriesOptions]="
         [{
            strokeStyle: 'rgb(239, 255, 0)',
            lineWidth:2.2
         },{
            strokeStyle: 'rgba(0, 250, 50)',
            lineWidth:1.2
         },{
            strokeStyle: 'rgba(222, 0, 0)',
            lineWidth:2.2
         }]
         "
         [props]="
         {
            grid: {
              fillStyle: 'rgb(0, 0, '+(i%2===0?10:100)+')',
              lineWidth: 0.5,
              millisPerLine: 250,
              verticalSections: 5
            }
          }
         "
       [values]="dynValues"
        ></ngx-row-streaming-chart>
This project was generated with Angular CLI version 6.1.2.
Development server
Run ng serve for a dev server. Navigate to http://localhost:4200/. The app will automatically reload if you change any of the source files.
Code scaffolding
Run ng generate component component-name to generate a new component. You can also use ng generate directive|pipe|service|class|guard|interface|enum|module.
Build
Run ng build to build the project. The build artifacts will be stored in the dist/ directory. Use the --prod flag for a production build.
Running unit tests
Run ng test to execute the unit tests via Karma.
Running end-to-end tests
Run ng e2e to execute the end-to-end tests via Protractor.
Further help
To get more help on the Angular CLI use ng help or go check out the Angular CLI README.