
Terminal Devtools
Terminal based Devtools for Node
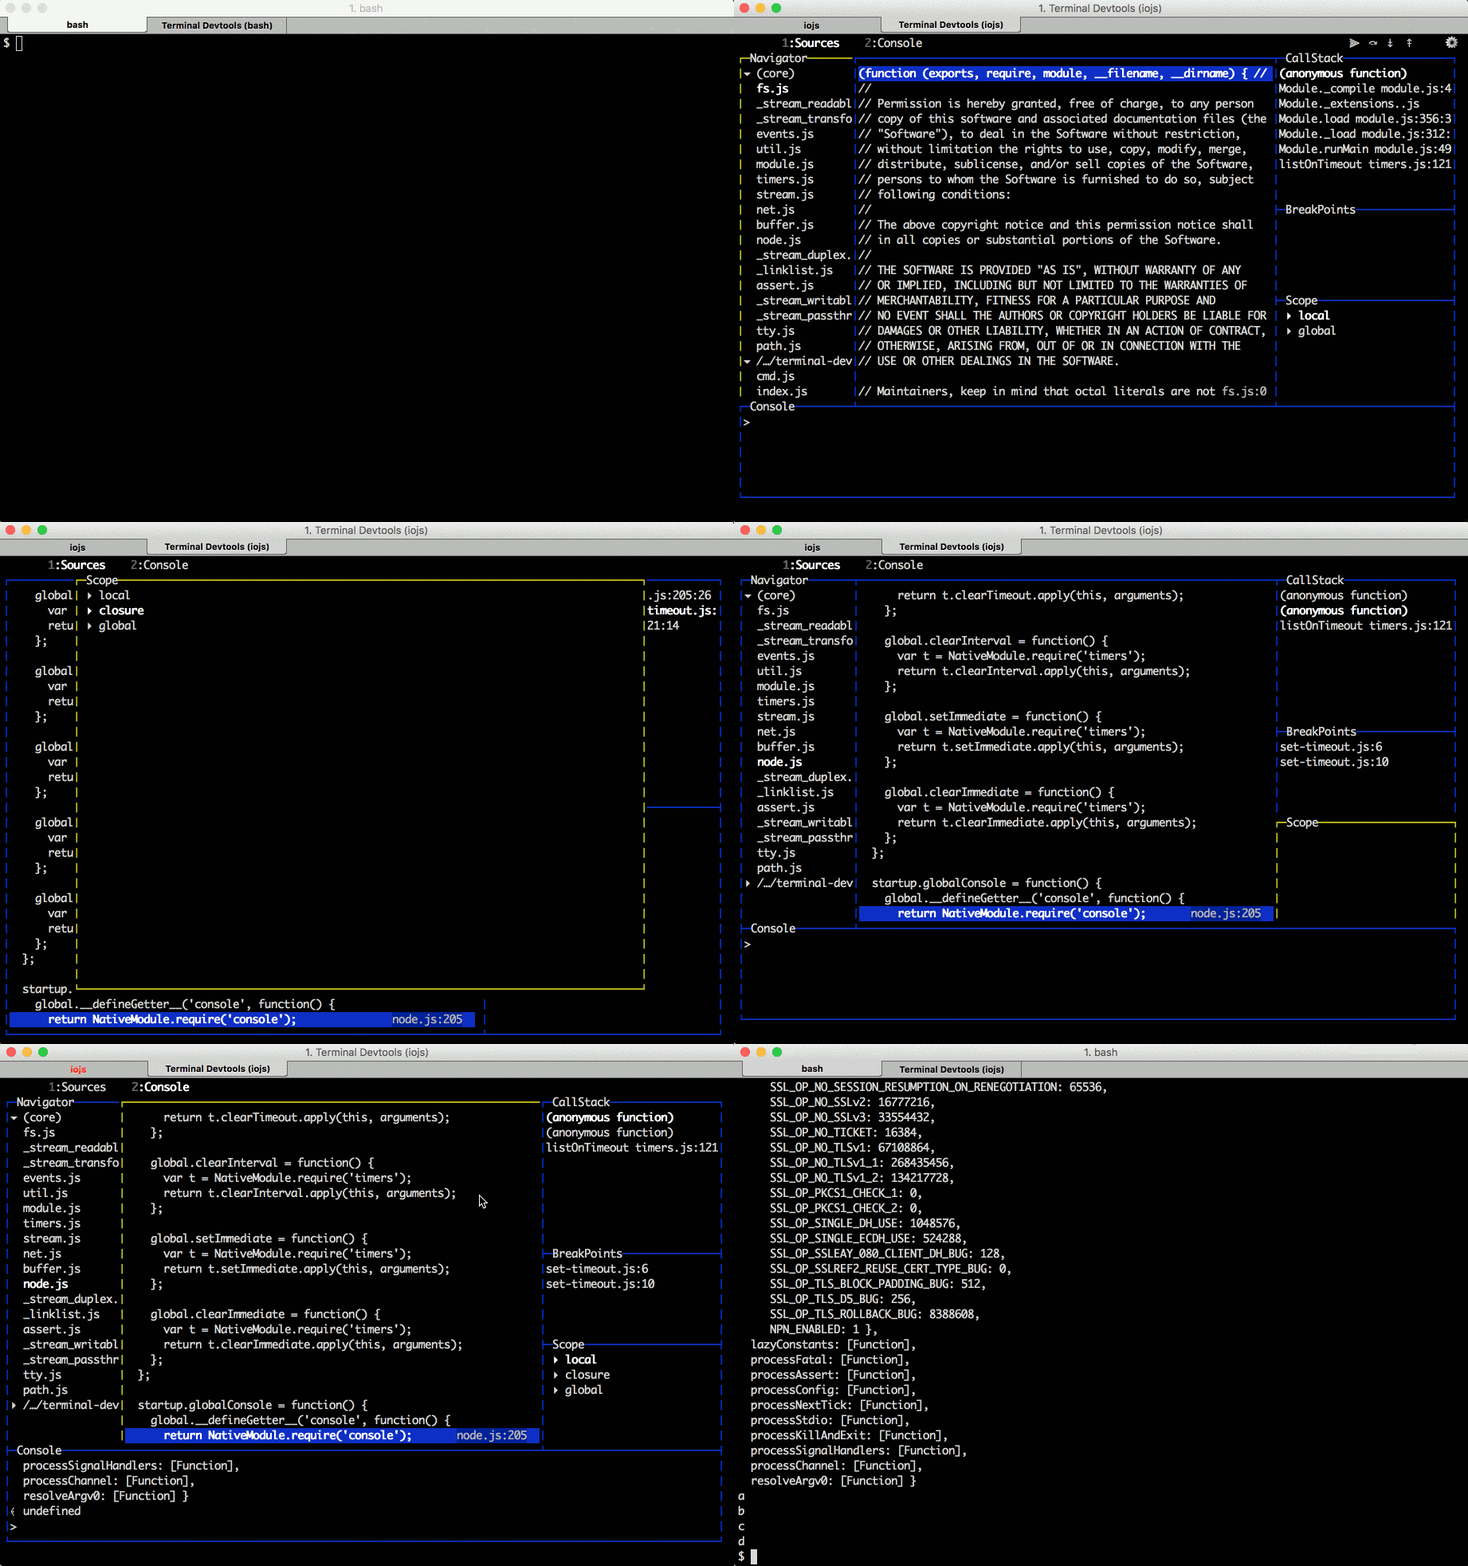
Status: Pre-release
Install
$ npm i -g terminal-devtoolsUsage
$ devtools [--port <port>] [--host <host>]By default devtools will connect to the default debugger port (5858)
$ devtools <pid>When a valid node Process ID is passed, devtools will send a SIGUSR2
signal to the process, putting it into debug mode then connect to port
5858.
Navigating
? - help and settings
c - continue, resume if paused, pause if resumed
n - step next
i - step iinto
o - step out of
b - set breakpoint (must be in code text panel)
tab - move forward between panels
shift+tab - move backward between panels
ctrl+n - navigator
ctrl+t - code text
ctrl+s - callstack
ctrl+p - breakpoints
ctrl+o - scope
ctrl+k - console panel
2 - select Console tab
arrow keys and vi keys (hjkl) control selections in panels
the mouse can also be used to select tabs, panels and items
Examples
Zero-config
Put a service into debug mode, break on first line
$ node --debug-brk examples/simpleConnect to default debug port
$ devtoolsMulti-process
If we need to use more than debug port we can specify
Expose debug port as 5859
$ node --debug-brk=5859 examples/debugger-single-tickConnect to custom debug port
$ devtools --port 5859Debug a running process
Start a process as normal, debug mode is completely off
$ node examples/debugger
3879
Process handily outputs PID, pass it to devtools
$ devtools 3879devtools puts process into debug mode and connects to debugger.
Layouts
There are two supported layouts, Normal and Minimal.
The layout can be changed in Settings (? or click the icon).
In minimal layout, hidden panels can be revealed as dialogs using the
ctrl based shortcuts (Navigator: ctrl+n, Scope: ctrl+o). To exit a
Scope or Navigator dialog press the esc key.
Contributing
More than welcome
See devnotes
Any questions, twitter: @davidmarkclem
License
MIT