
TurnScope
 · MIT License · 简体中文
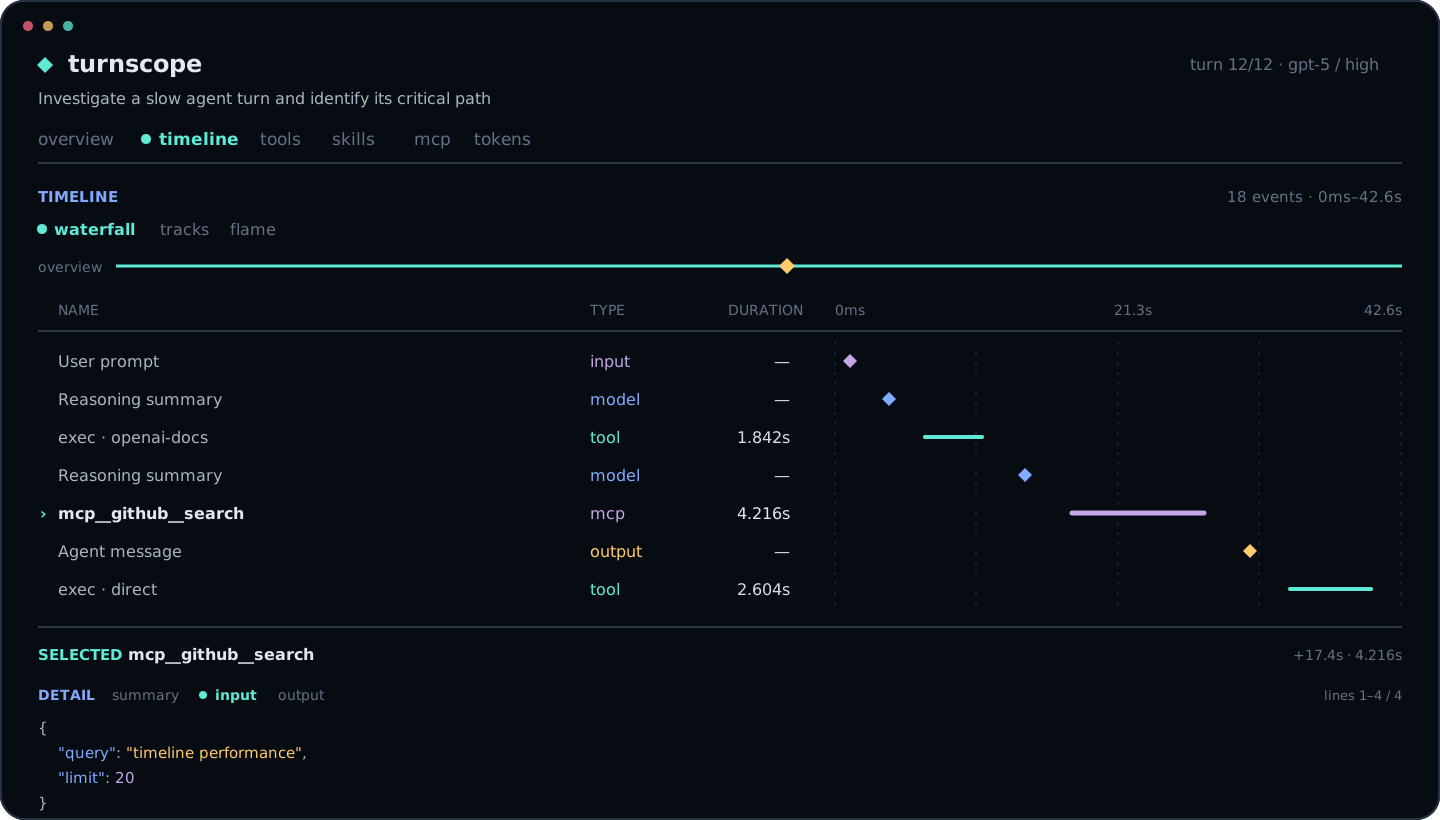
TurnScope is a read-only TUI for analyzing latency in local Codex sessions. It correlates rollout records, thread metadata, and SQLite telemetry to report per-turn timing, tool activity, Skill and MCP attribution, and token usage.
Analysis is performed locally. TurnScope does not modify Codex state or transmit session data.
Requirements
- A local Codex state directory containing
state_5.sqlite,logs_2.sqlite, and session rollout files - Node.js 18 or later for npm installation, or Go 1.26 or later for source installation
The default state directory is ~/.codex.
Installation
Install TurnScope through npm:
npm install --global turnscope
turnscope --latest
Run without a global installation:
npx turnscope --latestThe npm package supports macOS, Linux, and Windows on ARM64 and x64. All native binaries are included in the single turnscope package; installation does not run a download script.
Install with Go:
go install github.com/tageecc/turnscope/cmd/turnscope@latestBuild from source:
git clone https://github.com/tageecc/turnscope.git
cd turnscope
make build
Usage
Open the session picker:
turnscopeOpen the latest session, a specific thread, or a specific turn:
turnscope --latest
turnscope --thread THREAD_ID
turnscope --thread THREAD_ID --turn 0
Print a report without starting the TUI:
turnscope --latest --plainOptions
| Option | Description | Default |
|---|---|---|
--codex-home PATH |
Codex state directory | ~/.codex |
--thread ID |
Open the specified thread | Session picker |
--latest |
Open the most recently updated thread | Off |
--turn N |
Open a zero-based turn index | Latest turn |
--plain |
Print a text report instead of starting the TUI | Off |
--no-motion |
Disable TUI animation | Off |
--limit N |
Maximum sessions loaded into the picker | 100 |
--version |
Print version information | Off |
Views
| View | Data shown |
|---|---|
| Overview | Turn duration, time to first token, first visible output, tool wall time, model/orchestration residual, and source statistics |
| Timeline | Waterfall, parallel tracks, and proportional flame allocation for recorded events |
| Tools | Tool name, source, recorded duration, relative cost, and Skill attribution |
| Skills | Direct and inferred attribution, call count, cumulative tool time, and wall span from the first attributed call to the last |
| MCP | Server readiness, tool cache state, available tool count, calls, and call time |
| Tokens | Input, cached input, total output, reasoning output, estimated visible output, context use, and throughput |
Select a timeline event and press Enter to open the inspector. Tool events expose the recorded input, output preview, routing metadata, status, and total duration when those fields are available. The Summary, Input, and Output panes contain only data present in the local Codex records. Encrypted reasoning payloads are not decoded.
Timeline controls
| Key | Action |
|---|---|
v |
Cycle through Waterfall, Tracks, and Flame Allocation |
j/k, ↑/↓, ,/. |
Select an event |
h/l |
Pan the time window |
+/- |
Zoom around the selected event |
f |
Focus the selected event; press again to fit the turn |
/ |
Filter by event, tool, Skill, MCP server, detail text, or call ID |
c |
Show only duration-bearing events |
Enter |
Open or close the event inspector |
Tab, Shift+Tab |
Move between inspector panes |
s, i, o |
Open Summary, Input, or Output |
PgUp/PgDn, Ctrl+U/Ctrl+D, Home/End |
Scroll the inspector |
Use ←/→ or 1–6 to change the main view, [/] to change turns, r to reload the data, and Esc to return to the previous context.
Measurement model
| Metric | Definition |
|---|---|
| Turn duration | duration_ms recorded by task_complete. For an active turn without task_complete, the interval from task_started to the latest recorded event. |
| Time to first token | time_to_first_token_ms recorded by Codex for the completed turn. This may precede visible text. |
| First visible output | Interval from task_started to the first response.content_part.added event. |
| Tool cumulative time | Sum of recorded durations for all tool calls in the turn. Overlapping calls are included separately. |
| Tool wall time | Union of tool execution intervals. Concurrent calls are counted once. |
| Visible output time | Interval from the first response.content_part.added to the last response.output_text.done. |
| Model / orchestration | max(0, turn duration - tool wall time - visible output time). This residual can include transport, server wait, context processing, reasoning, and client orchestration; it is not a direct measurement of model reasoning. |
| Flame Allocation | Proportional rendering of model/orchestration, tool wall time, and visible output time. It is not a sampled CPU stack. |
Metrics that depend on unavailable telemetry are displayed as missing rather than estimated.
Data handling
TurnScope reads:
~/.codex/sessions/**/rollout-*.jsonl
~/.codex/state_5.sqlite
~/.codex/logs_2.sqlite
SQLite databases are opened with mode=ro and query_only(1). Installations that store the databases under ~/.codex/sqlite/ are also supported.
Tool output is limited to a 64 KiB in-memory preview per call; the recorded full size is retained in the report metadata. Reasoning detail is limited to plaintext summary or content persisted by Codex.
Session records can contain prompts, tool arguments, output, and local paths. Review inspector content before copying or publishing it.
Development
make test
go test -race ./...
go vet ./...
make build
make npm-test
make npm-packages
See CONTRIBUTING.md for contribution guidelines and SECURITY.md for vulnerability reporting.
License
TurnScope is an independent project and is not affiliated with OpenAI.