respvis-tooltip
A library to build responsive SVG-based visualisations.
A library to build responsive SVG-based visualisations.
A block chart with animations and passed json file values changeable from dropdown menu
A block chart with animations and passed json file values changeable from dropdown menu
quick gauge is a very simple gauge without the fuss. An immediate solution for immediate needs.
Webcomponent pugh-chart built using Lit
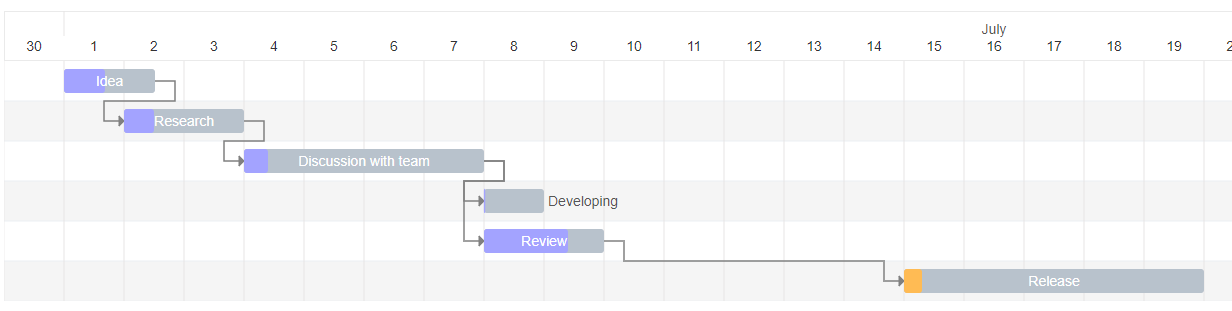
Interactive Gantt Chart for React with TypeScript.
Fork modified React charts
Interactive graphing tools for recharts
A flexible range visualization library with configurable styling
the `adial-dendrogram-d3` is a javascript library for create `adial-dendrogram` by `d3`. Technicals: `d3, typescript, react`
A web component for radial progress bars that is almost entirely CSS based heavily on @andsens' Medium article https://medium.com/@andsens/radial-progress-indicator-using-css-a917b80c43f9
radar component for react
Library to plot a radar diagram
Create stunning and dynamic radar charts with ease using RadarScope, the versatile open-source JavaScript library built with Chart.js. With customizable scales and multiple datasets support, bring your data to life with dynamic visuals.
A Echarts Component Library for Vue 3
View air conditions on a psychrometric chart
public-spread
React component to create interactive D3 tree hierarchies
Simple HTML5 charts using the canvas element.